


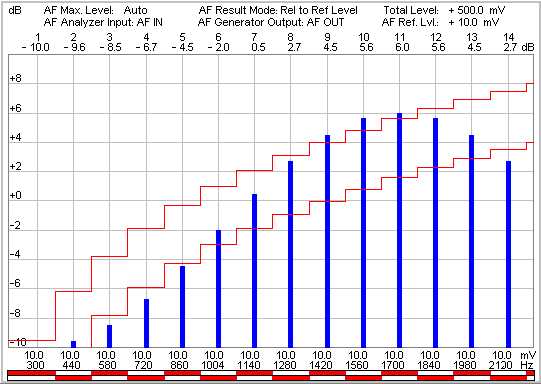
The Multitone measurement menu displays the individual levels at up to 14 out of 20 different test tones, corresponding to 20 (not necessarily distinct) audio input frequencies. The results and the test settings are indicated in two parameter lines and the actual test diagram (bar graph) with its axis labels:
| Parameter lines
Test tone no. and Bar graph with upper and lower limit lines Test tone voltage |
 |
Display of measurement results (Multitone)
| Parameter lines | The first parameter line contains the following settings and results: |
| AF Max. Level | Maximum AF input level in mV as set by means of the AF Max. Levels softkey described in section Test Settings. |
| AF Result Mode | Reference value for all levels as set in the configuration menu (see section Measurement Control (Audio Multitone Configuration - Control)) |
| Total Level | Sum of the individual levels of all test tones measured in mV. |
| The second parameter line contains the following settings: | |
| AF Analyzer Input | Input connector used for the Multitone measurement. In the AF Chan. One application, AF IN is used. |
| AF Generator Output | Output connector used for the Multitone measurement. In the AF Chan. One application, AF OUT is used. |
| AF Ref. Lvl | 0-dB line in the test diagram as set in the configuration menu (see section Measurement Control (Audio Multitone Configuration - Control)). |
|
Remote control |
| Bar graph | The bar graph shows the AF level in dB at a maximum of 14 out of 20 different audio frequencies corresponding to a continuous range of test tones configured in the Tone Def. tab of the configuration menu (see Test Tones (Multitone Configuration - Tone Def.)). If a test tone is disabled in the configuration menu, the corresponding bar is omitted. |
| Frequency axis (abscissa) | The range of test tones (no. 1 to 14, 2 to 15 etc.) to be viewed can be selected via the Display - Tone Scale hotkey in the section Test Settings. The bars representing the level of the different tones are equidistantly distributed over the whole diagram width. This optimizes the readability of the diagram but implies that the abscissa scale is not necessarily linear. Therefore, the frequency and voltage of every single test tone is displayed below the frequency axis. |
| Frequency response axis (ordinate) | The ordinate can be arbitrarily scaled by setting a maximum and minimum value (both in dB). With a fixed ordinate, the adjustable 0 dB reference line (see Level Scale hotkey in the section Test Settings) allows to shift the whole diagram vertically. |
|
Remote control |
| Limit Check | The upper and lower limit lines for each test point defined in the Limit Lines tab of the configuration menu (see Limit Lines (Multitone Configuration - Limit Lines)) correspond to the two red step functions in the diagram. If the result at a particular test point exceeds the upper limit (falls below the lower limit), the corresponding section of the upper (lower) bar across the bottom of the diagram turns red. |
|
Remote control |