|
|
 |
Importing Inductance Values from a Text File
Time varying inductances can be a critical tool in simulation for such uses as modeling
the EMF of a rotor rotation, creating a dynamic tuning control, and simulating many types
of magnetic applications. Modeling a time varying inductance in Micro-Cap can be done
through either a time based equation or by importing tabular values. Since in many
applications, it would be difficult to derive an equation to represent the varying
inductance versus time, importing tabular values is the more common method when simulating
such an inductor. Often these tabular values have been created in a text file by a third
party program. This article describes how to import inductance values from a text file
that contains a table of time versus inductance and how to use these imported values to
model a time varying inductor.
The file format that the time versus inductance table needs to be in is the USR (User Source)
file format. The USR format is essentially a table of comma delimited values with some basic
header information at the top of the file. Many third party programs will create the table
data within an Excel file. The conversion process from an Excel file to a USR file is
described in an article in the Fall 2002 newsletter issue called
Converting an
Excel File to a User Source File.
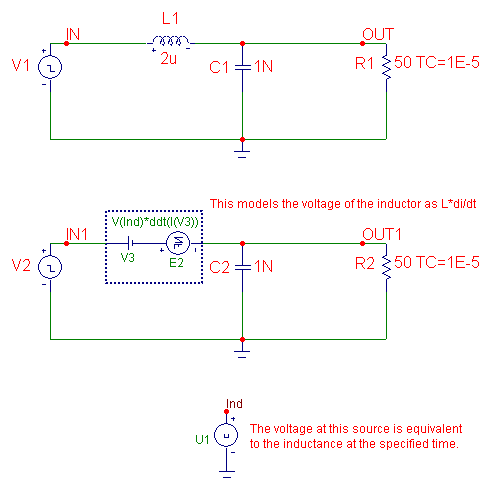
An example schematic that displays the method for modeling such a time varying inductance is
shown below. There are actually two circuits within the schematic. Both are simple
RLC circuits with a pulse source at the input. The top RLC circuit contains a constant,
ideal inductor. The bottom RLC circuit contains a time varying inductor model.
|

|
The first step in modeling a time varying inductor is to create the associated USR file
that contains the inductance values. For this example, the USR file that will be used is
called Winter2006.USR, and it contains the following information:
[Main]
FileType=USR
Version=2.00
Program=Micro-Cap
[Menu]
WaveformMenu=Ind vs T
[Waveform]
Label=Ind vs T
MainX=T
LabelX=T
LabelY=Ind
Format=SimpleNoX
Data Point Count=5
0,1e-6
1e-6,1e-6
2e-6,2e-6
3e-6,2e-6
4e-6,5e-6
The header for the User Source file consists of three sections. The [Main] section
defines the format version that is being used. This section should appear exactly as
it is shown here for all User Source files.
The [Menu] section defines the names of the waveforms that are present in the file. Since
there is only one waveform in this file, there is only one WaveformMenu tag defined. In
this case, the waveform is called ‘Ind vs T’. Micro-Cap uses these tags to display the
names of the waveforms within the file in both the Attribute dialog box and in the Analysis
Limits dialog box.
Each waveform in the file must have a [Waveform] section defined for it. This section
defines the names of the data columns and declares the format that the data is expressed
in. The Label tag must match one of the WaveformMenu tags in the [Menu] section. This tag
contains the string that is to be defined in the Expression attribute of the User Source
when the source is placed in a schematic. The Format tag defines the format that the data
is in. In this case, SimpleNoX states that there will be only two columns of data with the
left column being time and the right column voltage (T,Y). Since the format is SimpleNoX,
both the MainX and LabelX tags will be defined as T for time, and the LabelY tag is defined
as Ind for this waveform. The Data Point Count tag declares the number of data points the
waveform consists of. For this example, five data points have been defined for the
inductance values. The waveform will be linearly interpolated between data points.
The actual data points for the waveform should immediately follow the [Waveform] section.
The entire header can just be copy and pasted over to a new file while just modifying the
appropriate lines.
The USR file is imported into the schematic through the use of the User Source designated
U1. The U1 source has its relevant attributes defined as follows:
FILE = Winter2006.USR
EXPRESSION = Ind vs T
REPEAT = 1
The output of this source is the voltage at node Ind. The voltage at this node will be
equivalent to the value of the inductance that is to be modeled. There are a couple of
ways to model the actual inductor in the schematic. The method chosen here provides the
most robust capability in terms of convergence. The inductor is modeled with a combination
of a battery and an NFV (nonlinear function voltage) source. The V3 battery is defined with
a value of zero volts. Its only purpose is to measure the current through the branch. The
E2 NFV source models the actual inductor by simulating the voltage drop that would occur if
the inductor was present. The source has its VALUE attribute defined as:
V(Ind)*ddt(I(V3))
This expression simulates the basic L * di/dt voltage characteristic of an inductor by
multiplying the voltage at node Ind by the derivative of the current through the V3 source
with respect to time.
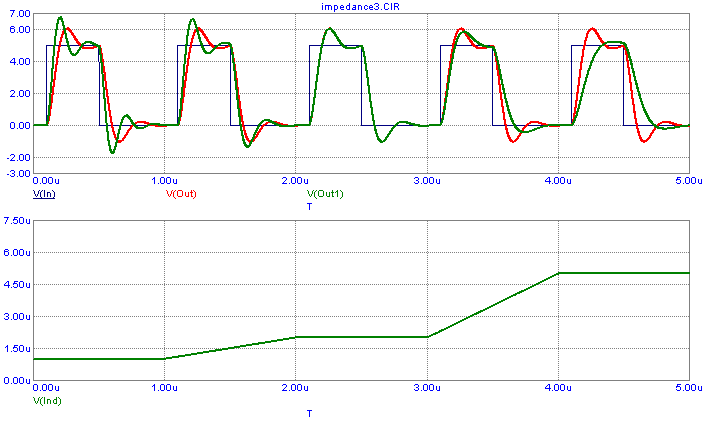
A transient analysis simulation of this schematic is displayed in the first simulation below.
The top plot in the simulation contains three waveforms. V(In) is the voltage at the input
pulse source of the ideal RLC circuit. The pulse sources for both RLC circuits share the same
specifications so the voltage waveform at node In1 would be the same. V(Out) is the output
voltage waveform of the RLC circuit containing the ideal inductor. V(Out1) is the output
voltage waveform of the RLC circuit containing the time varying inductor model. The bottom
plot in the simulation contains the voltage at node Ind which shows the time varying
inductance value the V(Out1) waveform is being affected by.
Note that when the time varying inductance value is specified as 2uH between 2us and 3us, the
voltage waveform at node Out1 matches the voltage waveform at node Out which has a constant
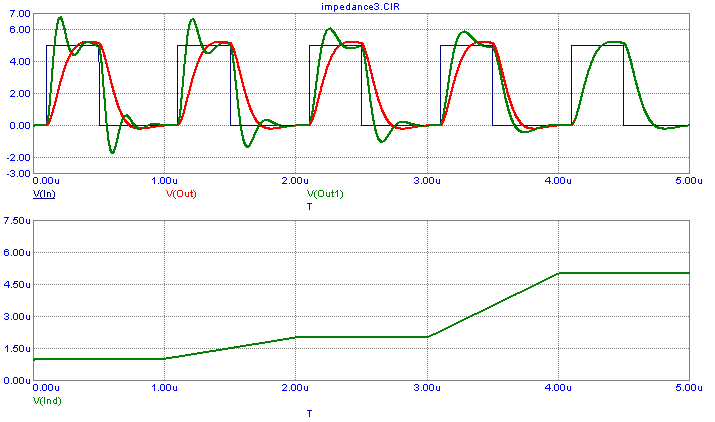
inductance of 2uH over the course of the simulation. For a second transient analysis
simulation, the ideal inductor in the schematic has been defined with the value of 5uH. The
resultant analysis is displayed in the second simulation. Now the two output voltages match
during the fifth cycle of the simulation when the time varying inductance is specified as
5uH also.
|

|

|
|
|
|
|


