|
|
 |
|

|
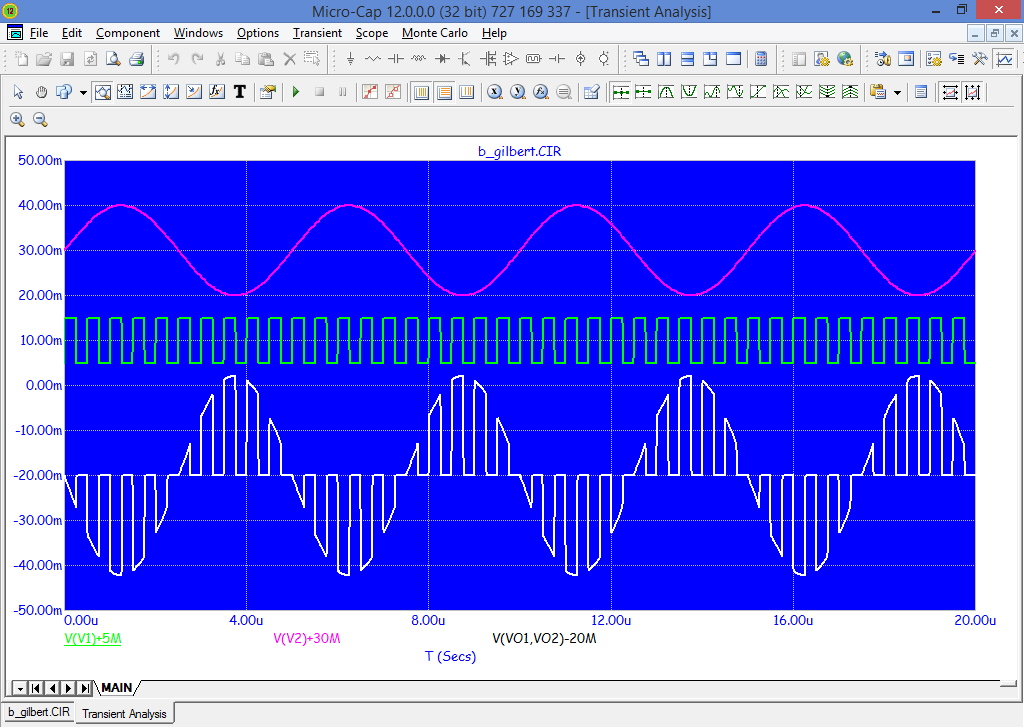
Waveform Plotting - During the Run
|

|

|
| |
So you can see exactly what's occurring, Micro-Cap produces
waveform plots and graphs during the run. As a result, you
can stop the run to correct problems and avoid wasted time.
And it's also much more interesting.
You can also change simulation parameters - like temperature,
simulation time, or initial conditions - and run a new
simulation without recompiling the circuit.
For reviewing waveforms, you may zoom, pan, resize, scale,
tag data points, inspect values, and analyze waveforms and
curves. Scope lets you magnify a waveform, read out its
value, check its slope, find a peak, normalize the waveform,
compare it to another waveform, measure its rise time,
fall time, width, period, peak-to-peak value, or many
other performance criteria.
You can also annotate the plot with text, add graphics,
and add numeric tags that show the X and Y values at
individual data points or between two data points.
|
| |
|
|
|


