|
|
 |
Importing Graphical Templates
In designing a circuit, the output response may need to fall within a certain range. For example, a filter may be designed in order to meet certain frequency response specifications. It is possible in Micro-Cap to create graphical templates that let you plot the maximum and minimum characteristics of a waveform to ensure that the output response falls within the correct range. There are two methods for plotting templates in AC analysis: using the Import function or using a Laplace table source.
Importing a Text File
The simplest method is to create a text file that can be used with the Import function to plot the template. The text format that the Import function can handle is the format that is created by the numeric output option in Micro-Cap or the SPICE text output option from another program. The following is an example of this format.
|
|
Temperature = 27 Case= 1
|
| |
|
F
|
bppass
|
|
(KHz)
|
|
|
0.325000
|
10
|
|
0.420000
|
38
|
|
1.150000
|
38
|
|
1.600000
|
10
|
| |
The above text has been placed in a file called Bpmax.out. The first line indicates the specific run that this data is to be imported with. If this data does not match the type of run then an error will occur. In this instance, the first line specifies that the analysis is run at 27C and that it covers the first run performed (Case=1). The data is then listed in tabular columns. There may be more than two columns of data, but they will all share the same X axis data.
The first column will always be the X axis data. For transient analysis, it must be time. For AC analysis, it must be frequency. For DC analysis, it must be the current or voltage of the source that is being swept. Note that the units for the frequency column are placed on the line below the waveform header, but they may also be included on each line of data instead. If the units are specified in engineering notation, MHz must actually be specified as MegHz.
The second column specifies the Y axis data. In this case, the waveform has been called 'bppass'. The waveform may be given any unique name as long as it has 9 or fewer characters and matching sets of parentheses. There is no need to specify the type of waveform that the data represents such as voltage or current. It will plot according to the data in the column, so the above data could be used with voltage in magnitude or dB, current, phase, or any type of waveform that is plotted. During simulation, the Y axis variable will remain constant for any X axis input that is less than the lowest specified X value or greater than the highest specified X value.
The above file will be plotted as the maximum template for a bandpass filter. The template is designed to make sure that the magnitude of the filter output voltage, when the input is a 1V AC small signal source, does not exceed the limits defined in the template. A second template will also be plotted using the same technique. This template will define a minimum voltage level for the filter. The information for the minimum template is contained in a separate file called Bpmin.out. This file appears as follows:
|
|
Temperature = 27 Case= 1
|
| |
|
F
|
bppass
|
|
(KHz)
|
|
|
0.325000
|
-5
|
|
0.500000
|
33
|
|
1.000000
|
33
|
|
1.505000
|
-5
|
| |
The maximum and minimum template waveforms have both been referred to as 'bppass' which is fine because they are contained in different files. In the User Definitions file, which can be accessed through the Options menu, the following two .define statements are entered.
.define bpmax import(bpmax.out,bppass)
.define bpmin import(bpmin.out,bppass)
These two statements let the templates be imported easily into an AC simulation by just specifying 'bpmax' or 'bpmin' in the Y Expression field of the AC Analysis Limits dialog box. Since the .defines in the User Definitions file are global, any circuit can use the 'bpmin' or bpmax' specifications to plot the template waveforms in AC analysis.
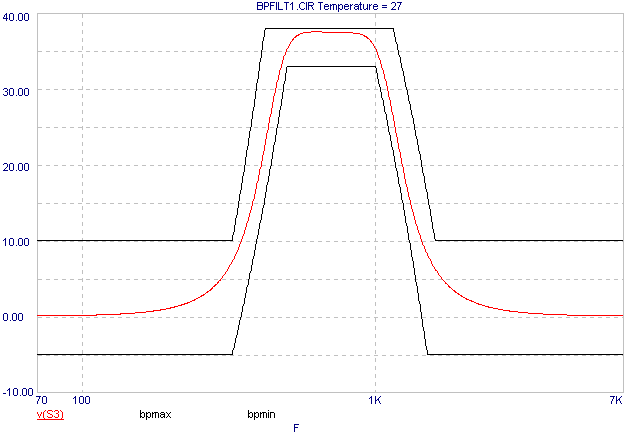
The figure below displays the results of a single AC analysis run of the bandpass filter. The V(S3) waveform is the output of the filter, and the bpmax and bpmin waveforms provide the template for the filter analysis.
|

|
The Import method is the easiest method to use. No components need to be placed in the schematic, and once the text files are created, the template can be plotted by just specifying the import function or .define variable in the Y expression field. The drawback in this method occurs when multiple runs are simulated as in a Monte Carlo or stepping run. Each run needs to have a separate data listing within the imported file. For example, if a 10 run Monte Carlo analysis is to be simulated, the Bpmax.out file would have to contain ten copies of the data. The only difference in the data would be that the Case value would have to be incremented for each copy. A simulation involving stepping would also need to have as many copies of the data as there are runs. Instead of the Case value, the name and value of the component being stepped would need to be specified in the header. For this reason, using Laplace table sources to import AC templates is a simpler method in the case of multiple run simulations.
Using a Laplace Table Source
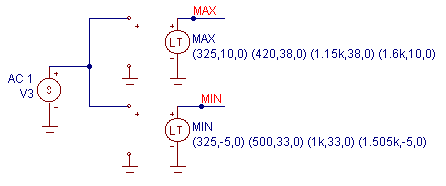
The Laplace table sources can handle triplets of data in the form of (frequency,magnitude,phase). The sources will interpolate between specified data points and will be constant for any frequencies that are below the lowest frequency and above the highest frequency. The Laplace table sources would have to be added to a schematic in the configuration that appears below in order to produce the two template waveforms from the first method.
This configuration consists of two Laplace table sources and a SPICE independent source. The number of Laplace table sources is dependent on the number of template waveforms being plotted on a 1:1 basis. The SPICE independent source can be found in the Waveform Sources section of the Analog Primitives and is called 'V'. This source has its VALUE attribute defined as 'AC 1' to supply a 1 volt small signal waveform to the Laplace sources. Either a SPICE independent source, a sine source, a pulse source, or a user source must be present at the input of the table sources to provide the correct AC stimulus. Otherwise, the template plot will be incorrect.
|

|
The FREQ attributes in the table sources have been defined with the same data that was contained in the Bpmax.out and Bpmin.out files. The phase data has been specified as 0 for each data point as it is not being used in this case. The FREQ attribute for the Max source (maximum template) is defined as:
(325,10,0) (420,38,0) (1.15k,38,0) (1.6k,10,0)
The FREQ attribute for the Min source (minimum template) is defined as:
(325,-5,0) (500,33,0) (1k,33,0) (1.505k,-5,0)
The KEYWORD attribute for both sources has been specified as MAG to indicate that the magnitude value is expressed in true magnitude rather than in dB. The table sources will produce a voltage output that is equivalent to the desired template. The figure below displays the AC analysis results of a 10 run Monte Carlo analysis. The waveforms V(Max) and V(Min) are the template waveforms calculated from the table sources.
|
|
|
|
|


