|
|
 |
Using the Optimizer to Set Oscillator Frequency
The optimizer can be used for many tasks, from optimizing a design to curve-fitting.
One task that frequently comes up is oscillator frequency setting. This article will
describe how to do that for a Wein-Bridge oscillator. Consider the circuit below.
|
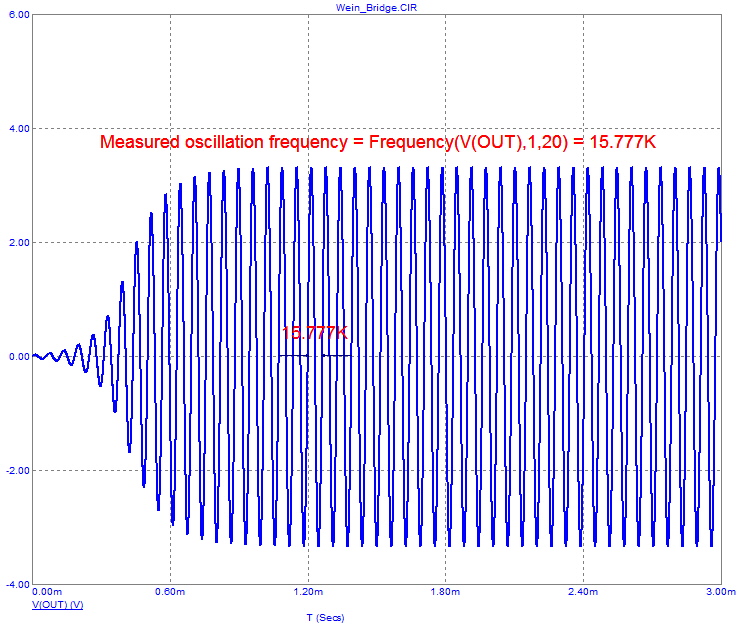
The circuit is set up to produce a sine wave of about 15KHz.
Its transient run looks like this:
|

|
The plot has two objects that measure oscillation frequency. First there is a piece of
formula text:
Measured oscillation frequency = Frequency(V(OUT),1,20) = [Frequency(V(OUT),1,20)]
This text uses a performance function to measure the frequency of oscillation. If you double click
on the text (while in Select mode) you see its text dialog box.:
Note that the Formula box is checked and that square brackets are used to delimit the
formula. The actual function is:
Frequency(V(OUT),1,20)
This performance function measures the frequency of the waveform V(OUT), conditioned
with a Boolean value of 1 (always true), with the measurement taken at the 20'th cycle
to allow for some settling time.
Note that the delimiters tell the program where the formula is so that it can be
distinguished from the remaining text.
There is another object in the plot, a Performance Tag. The tag's text looks like this:
Frequency(V(OUT),1,20)
The tag measures the same frequency that the text measures but places a set of arrows
to indicate where it is making the measurement.
To see the optimizer select it from the Transient menu, or press CTRL+F11.
The dialog box looks like this:
The optimizer is set up to find the value of the parameter C (which is C1's value) to
equate the frequency to 10 KHz. It uses the same performance function used in the plot:
Frequency(V(OUT),1,20)
Press F2 to start the optimizer. After a few seconds the screen looks like this:
The optimizer has calculated 1.58196nF for the C1 value needed to produce a frequency of 10KHz.
As it stands, the value of C1 is unchanged. If you want to use the optimized value in the circuit you
can do so by pressing the Apply button. Do that now and then press the Close button.
Now press F2 to run the analysis using the optimized value.
The plot should look like this:
As you can see the measured frequency is 10K as specified. Notice that the theoretical frequency for
the optimized value of C1 is 1/(2*PI*R* 1.581961n) = 10.061K but the actual measured frequency
is 10.0K. The theoretical frequency formula assumes an ideal gain element.
Several things to keep in mind:
Test the circuit with your performance function before optimizing: Use a range of C1 and
Maximum Time Range values to be sure that the optimizer can actually find a useful frequency. For
instance, if you had used a TMAX of 1ms the optimizer would fail because it would not have found
a 20'th cycle to measure.
Use an adequate Maximum Time Step: If the time step is too large the optimizer may find an
inaccurate value. How can you tell? One way is to run with formula text (or if you have MC11, the
Measurements window) measuring frequency, trying different timesteps. Keep increasing the Maximum
Time Step until you see a significant change in the measured frequency. Use the largest value
you can to minimize optimization run time. If the timestep is too large you get inaccurate measurements.
If it's too small the runs take too long.
|
|
|
|
|


