|
|
 |
Fourier Analysis Guidelines
Fourier analysis is an important adjunct to transient analysis. Used properly, it can
provide invaluable information about the frequency content of transient waveforms. But
how do you use it properly? Here are some guidelines:
1) Make sure that the FFT frequency step (the FFT fundamental frequency) matches the lowest frequency of all
sources in the circuit.
If you have more than one source, examine each and determine
its frequency. Then take the lowest frequency and make sure it matches the computed
Frequency Step at:
Properties Menu (F10) / Fourier / Frequency Step
The Frequency Step is computed as follows:
1 / (Upper Time Limit - Lower Time Limit)
The Upper Time Limit should nearly always be TMAX from the transient analysis Time Range.
The Lower Time Limit defaults to TSTART which is usually zero. It is the point at which
data collection begins (all other plot data prior to that is discarded).
2) Simulate long enough to get past the initial transients.
Transients make the waveform aperiodic, tainting the FFT results. There are two
useful options here:
a) Use Periodic Steady State. (PSS)
b) Use a long run and exclude the transient-tainted front part.
Always use PSS if it is available. PSS is only available from MC10 on. Also, PSS does
not work with circuits containing transmission lines, digital parts, Laplace sources,
Z-transform sources, or N-ports, and PSS sometimes fails to converge.
In that case you use option b.
Set the Time Range long enough to minimize transients and still leave enough time at
the end to cover the FFT fundamental period. By making the Lower Time Limit greater than
zero, you can remove transient portions of the waveform, making
it more periodic.
3) Use a small enough timestep to get an accurate waveform.
For ordinary work, make the Maximum Time Step, DTMAX = TMAX / 100. For
higher precision use DTMAX = TMAX / 1000. Using a smaller DTMAX will produce an
improvement in the accuracy of the smaller harmonics.
4) To increase the frequency resolution make the time range longer.
Since the Frequency Step is:
1 / (Upper Time Limit - Lower Time Limit)
increasing the value of Upper Time Limit makes the frequency step smaller providing finer
resolution. If you do this, donít forget to increase the number of harmonics to auto
scale to compensate in the FFT plot.
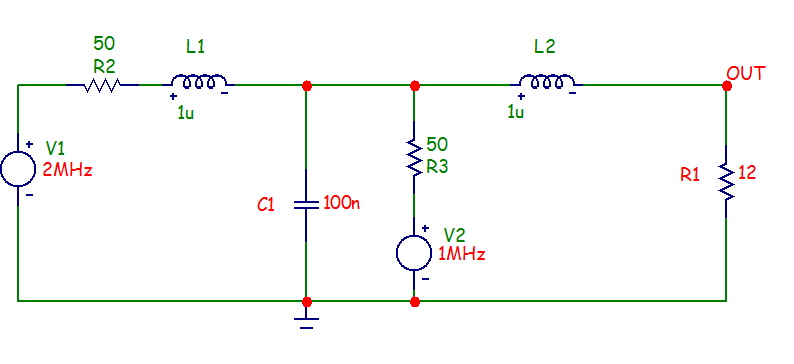
So let's see how this works in an actual example. Consider this circuit:
|

|
This circuit has two sine wave sources, V1 at 2MHz and V2 at 1MHz. So immediately we
know the FFT will have important frequency content at these frequencies and we know that
the FFT Frequency Step value must be no larger than 1MHz.
Select transient analysis,
then select Transient menu / Fourier Windows / Add Fourier Window. It has already
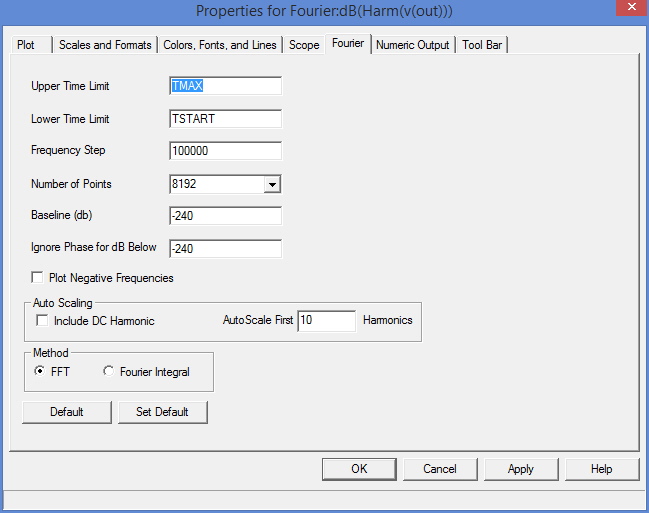
selected the dB(Harm(V(OUT))) for the plot. Select the Fourier tab. It looks like this:
|

|
This is the Fourier panel for the Fourier Properties dialog box. There is a similar
dialog box and panel for the Properties for Transient Analysis. To access the Properties
dialog box, use F10 from either the Fourier window or the transient analysis plot.
The important fields of this window are these:
Upper Time Limit: This sets the upper time limit for FFT functions. Generally this is
set to a multiple of the fundamental period, typically 3-5 periods.
Lower Time Limit: This sets the lower time limit for FFT functions. This is set
to a multiple of the fundamental period to avoid startup transients in the target
waveform and is typically 2 - 4 periods.
If PSS is used, and it usually should be, you can employ one period.
Frequency Step: This is the fundamental frequency computed from the difference in the
upper and lower time limits. If you enter a value, then MC11 computes a compatible
value for the lower time limit. The formula used is:
Frequency Step = 1 / (Upper Time Limit - Lower Time Limit)
You can also use these variables in the time limit fields:
TMAX Maximum run time of the transient analysis
TSTART Time when data collection starts typically 0
For example, you might use TMAX as the entry in the Upper Time Limit field and TSTART
or (to exclude startup transients) perhaps 0.5*TMAX as the entry for the Lower Time
Limit field.
Number of Points: This sets the number of interpolated data points to use for FFT
functions. Typically 1024, 2048, or 4096 are nearly always suitable choices.
Auto Scaling: This group controls auto scaling options and includes these options:
Include DC Harmonic: This option includes the DC harmonic when auto scaling is done.
Typically it is disabled.
Auto Scale First .... Harmonics: This number specifies the number of harmonics to
include when auto scaling.
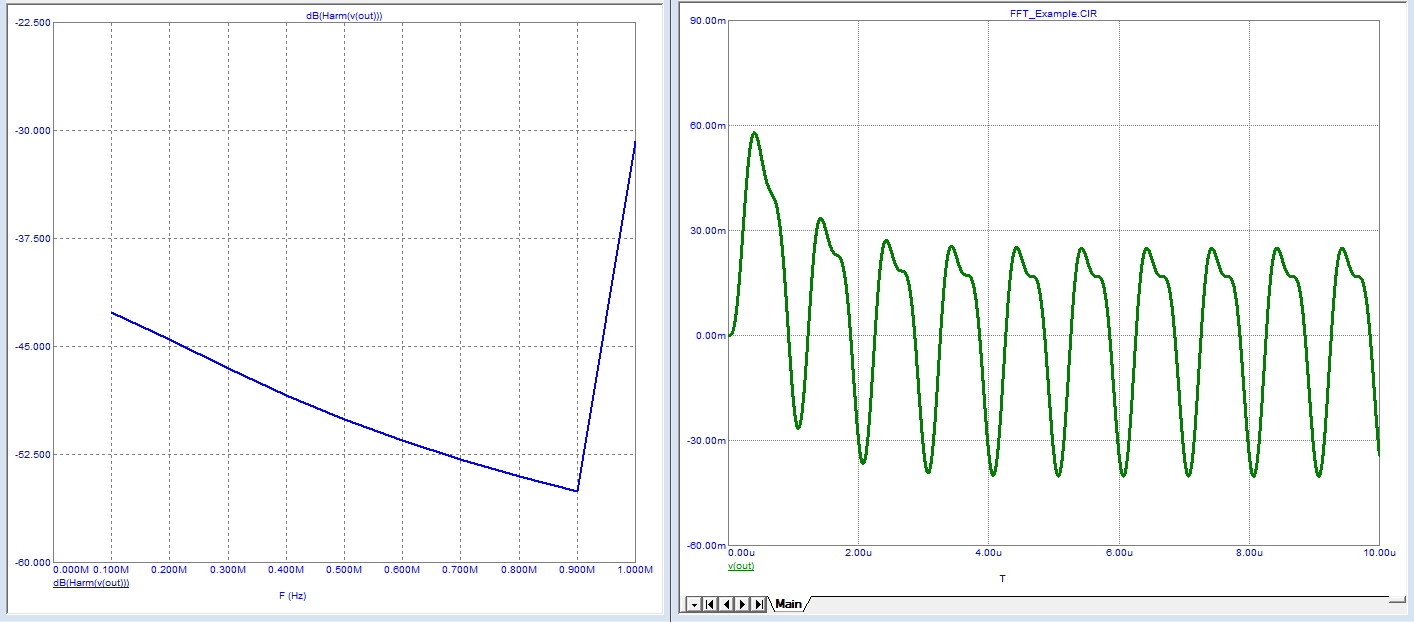
Press F2 to start the run and the screen should look like this:
|

|
The first thing you notice is that we barely get the 1MHz in the plot. That's because the
Number of Harmonics to include in auto scaling is 10 and the frequency is computed as,
Frequency Step = 1 / (10uS - 0) = 100KHz
Click on the Fourier window, then press F10. Select the Fourier tab and change the
Auto Scale First value from 10 to 50. Press F2 to start the run and you should see
this:
|
Now we can clearly see the 1MHz and 2MHz values. There is a significant amount of
aliasing due to the initial transients which causes the waveform to be non-periodic.
Let's fix that with PSS. Press F9 and enable Periodic Steady State.
Press F2 to
start the run. You should see this:
|
Notice now that the noise floor is about 170 dB versus 50dB before. Suppose we
couldn't use PSS. What then? Well we can use a tighter lower window limit to eliminate
much of the transient. Press F9 and disable Periodic Steady State.
Click on the
Fourier window, then press F10. Select the Fourier tab and change the Lower Time
Limit to TMAX/2. Notice that this changes the Frequency Step to 200KHz. Press F2 to
start the run and you should see this:
|
The noise floor now is about 100 dB. Better than the original 50dB, but not as good
as PSS. How about increasing the frequency resolution? Here's how to do that. Press F9,
change the Time Range to 50u. Click on the Fourier window,
then press F10. Select the
Fourier tab and change the Baseline to -400 and change Auto Scale First to 200 harmonics.
Press OK then F2 to start the run. It should look like this:
|
Things to Watch Out For
There are two Properties dialog boxes: one for transient plots and one for Fourier
Windows.
When a transient analysis is complete, the focus is sent to the analysis plot,
so pressing F10 to see the Properties dialog will invoke the Properties for Transient
Analysis. Any changes made here in the Fourier tab will affect only Fourier functions
in the transient analysis plot.
To display the Properties for Fourier, first click in the Fourier window and then press
F10. Any changes made here in the Fourier tab will affect only Fourier
functions in the
Fourier Windows.
|
|
|
|
|


