Spectrum Software
spacer
Industrial Strength Simulation
select:

divider


divider


Performance Functions


Micro-Cap comes with a library of functions that measure curve parameters. There are functions that measure pulse width, rise and fall time, frequency, period, X and Y level and many more.

These functions can be used in many ways:

As tags that are drawn with arrows to show how the measurement was done

In analysis text added to the plot to report the values

In Performance Plots that show the measured value vs. a stepped value

In Monte Carlo histograms

In the analysis plot GoTo function

In each use, the function takes a specified curve and measures one parameter. Usually the parameter is important to the design of the circuit and so the functions are called performance functions.

The complete list of functions is shown in the Reference Manual so here we will just be illustrating a few functions to emphasize their usage and value.

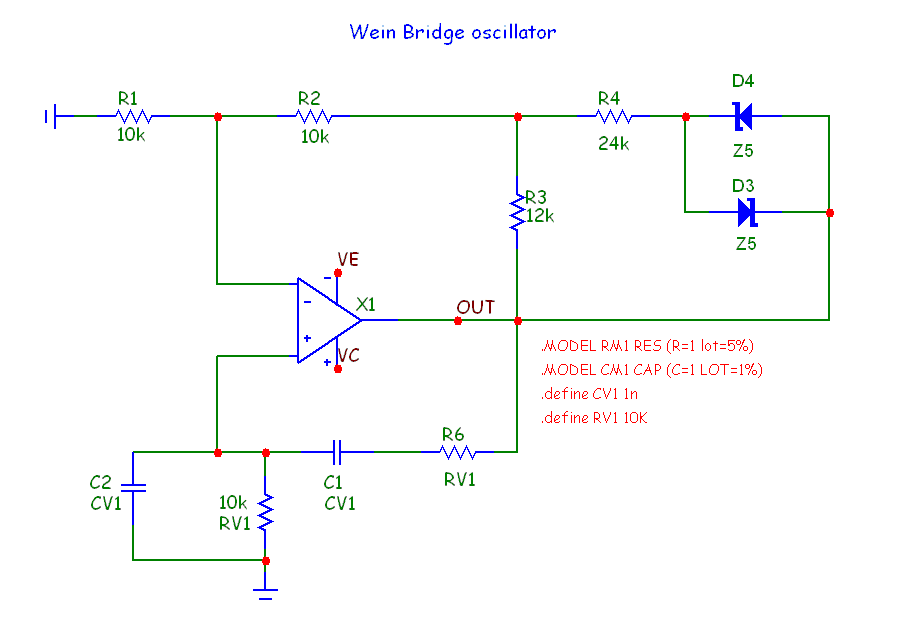
Here is the circuit we'll use: a Wein bridge oscillator.

Wein bridge oscillator

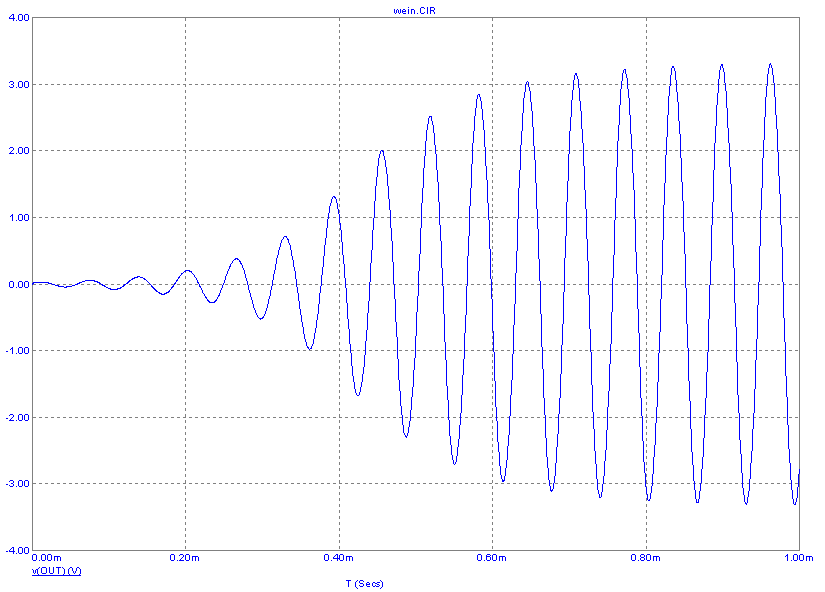
This circuit is set to start oscillating almost immediately. Run transient to get the first plot shown in the next figure.

Initial transient run

Let's suppose you are interested in measuring the oscillation frequency. You can do that this way:

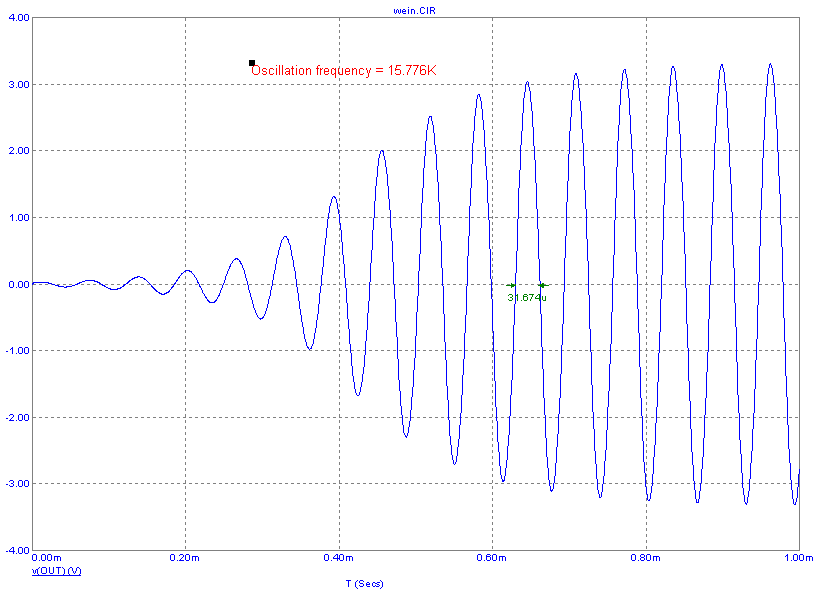
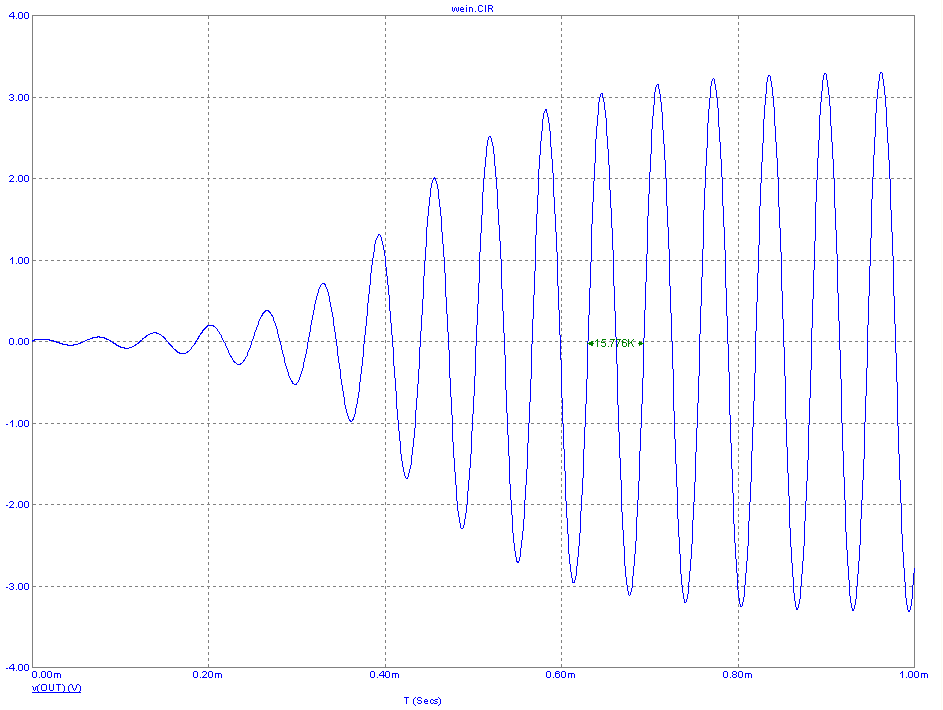
First click on the Performance Tag Mode button. Then click on the analysis plot anywhere. When the dialog box pops up click on the Get button. This loads a second dialog box which lets you select the performance function. Select Frequency from the pop down list and enter 10 in the N data field. This tells the program to find the frequency and use the tenth measurable instance. Why 10? Because we're simulating the startup phase and it takes a little time before the frequency has stabilized. Click OK on the dialog boxes and the plot looks like this:

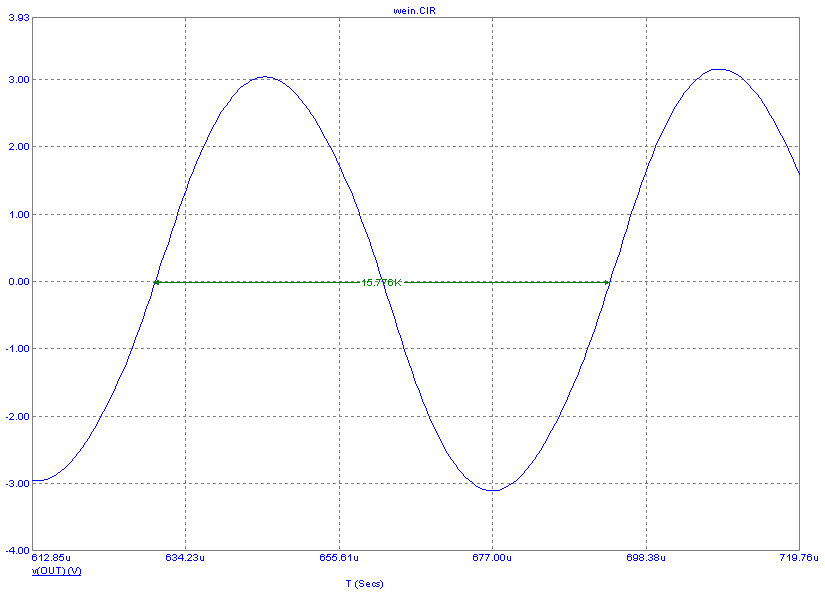
Frequency tag

The function measures a frequency of 15.776 KHz by measuring the time between subsequent instances of the waveform average. It denotes the two points used in the measurement with an arrow so you can see where the frequency measure is taken.

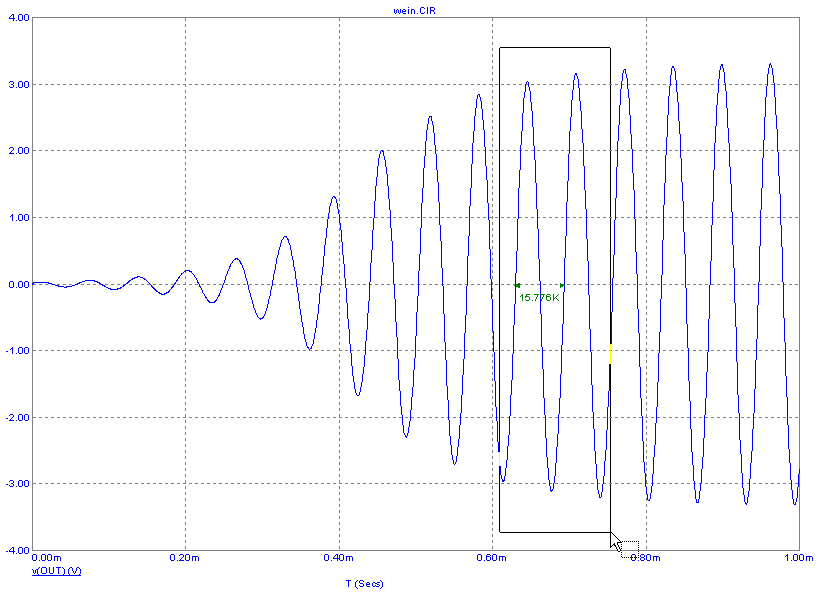
To see that a little more clearly click on the Scale icon and drag a box like so.

Plot blowup

Release the mouse button and you'll see this display.

Frequency measurement

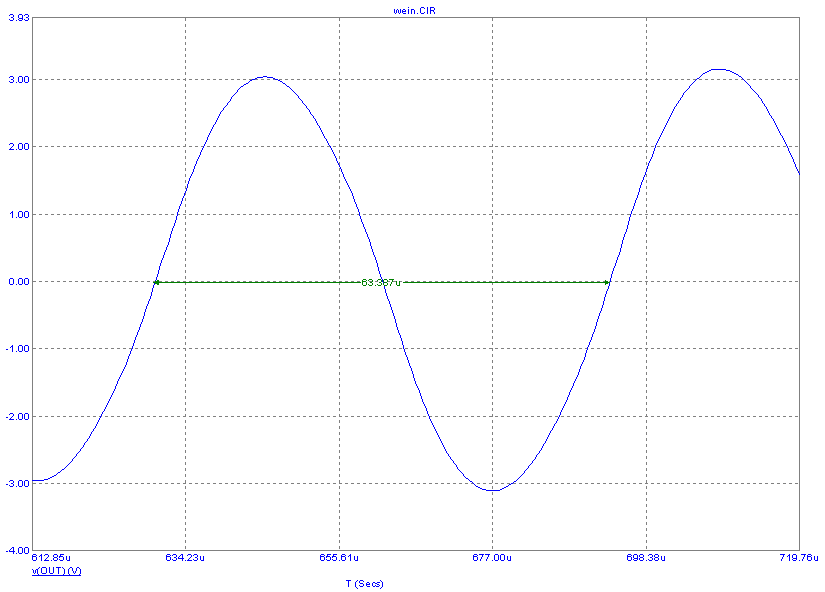
Press the Spacebar to get to Select mode. Double-click on the measurement value. Use the mouse to select the entire text 'Frequency(v(OUT),1,10)'. Then click on the Get button and in the Function list of the dialog box that comes up, select Period from the list. Type 10 into the N field. Click on the OK button and on the OK button in the tag dialog box. You should see this display


Period measurement

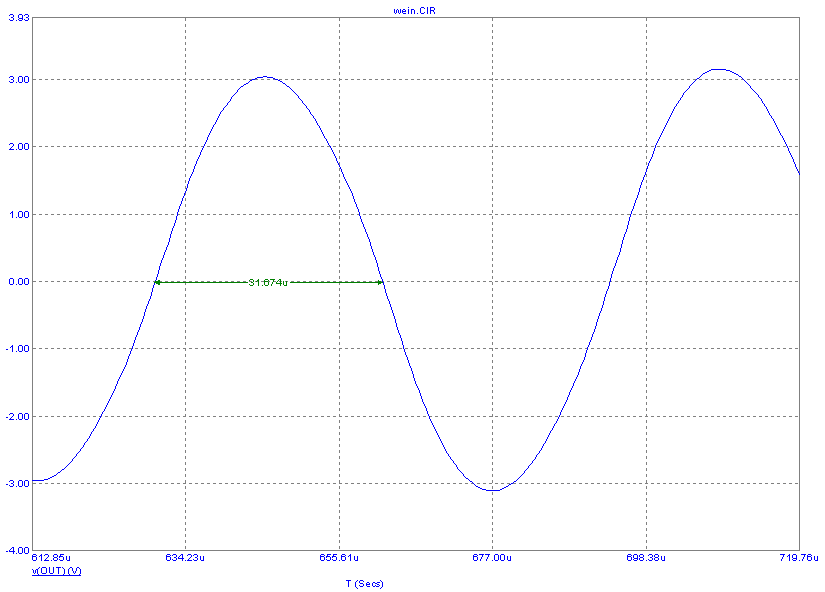
The period tag should show 16.387u. Now suppose you want to know the pulse width. You repeat the prior procedure but select Width instead of Period. Enter 11 into the N field and 0 in the Level field. You should now see this display.


Width measurement

The function measured the 11'th instance of a pulse that crossed 0 volts. How do you know which value of N or which value of Level to use? The value of N is obtained by estimating the number of pulses from T=0 and then tweaking the value plus of minus. The value of Level is clear in this case because the oscillator moves about zero. In general to meaningfully measure width you'll have to know something about the circuit.

How else can the performance function be used? Well you can use them to measure a performance parameter and then include that function in analysis plot text like this:

Oscillation frequency = [Frequency(V(OUT),1,10)]

In this text the [] brackets denote the area that contains formula text. The "Frequency(V(OUT),1,10)]" text between the brackets is the performance function. The rest is just text. To see how this works press CTRL+Home to restore the limit scales. Click on the Performance Tag icon and then somewhere in the analysis plot. In the Performance Tag dialog box click on the Get button and select Frequency(v(OUT),1,10) as we did earlier. Click on the OK button and then select the Frequency(V(OUT),1,10) text and press CTRL+C to place it in the clipboard. Click Cancel because we are only using the Performance Tag dialog box to capture the function text we want.

Click on the Text icon and then click in the analysis plot where you want the text to be placed. Enter the text above (you can paste in the function text from the clipboard) into the text dialog box. Check the Formula option in the dialog box and then click OK. The plot should now look like this:


Using performance functions in text


The function is evaluated, the frequency measured, and the result printed in the text wherever it is placed. This form is sometimes a convenient alternative to the tag as a way to measure and display important parameters.

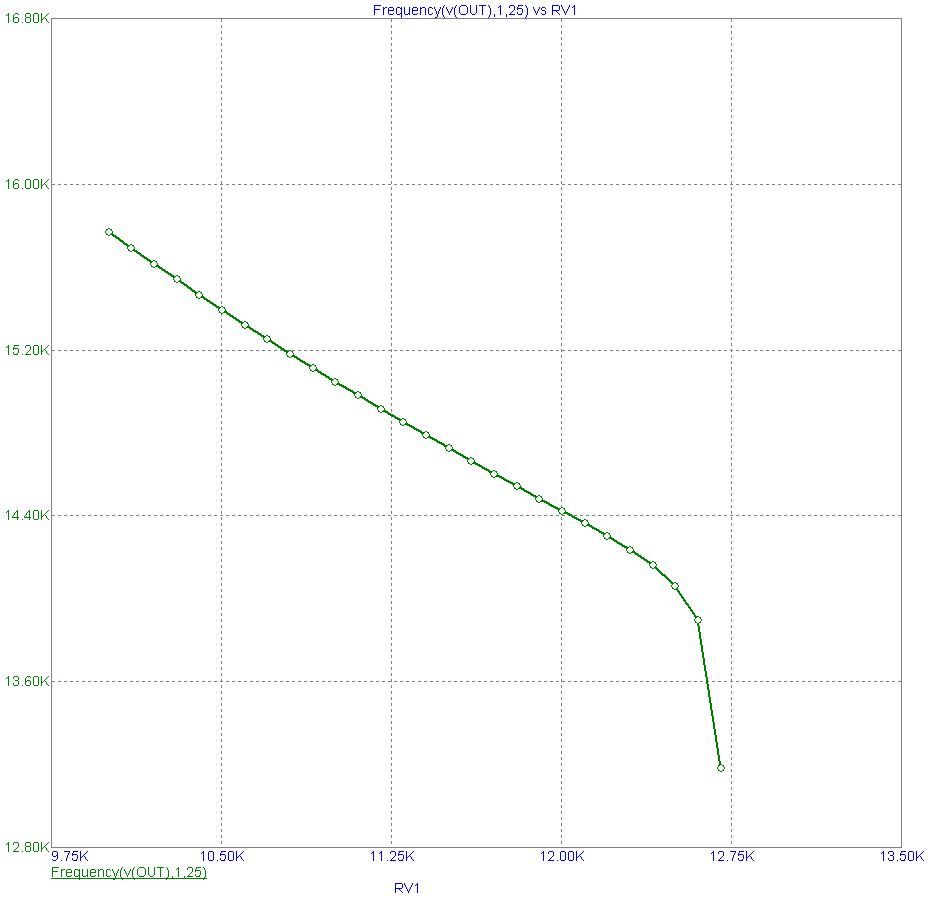
There are other ways that performance functions are used. Here is the same circuit but set up to step the RV1 parameter and plot the frequency vs. RV1. The function is Frequency(v(OUT),1,25) and the simulation run is for 2ms.


Performance plot

This Performance Plot shows the measured frequency vs. the stepped RV1 parameter. There is a clear linearity up to about 13K and then the curve becomes nonlinear, an important piece of design information.

Performance Plots use performance functions and plot these functions versus a stepped parameter.

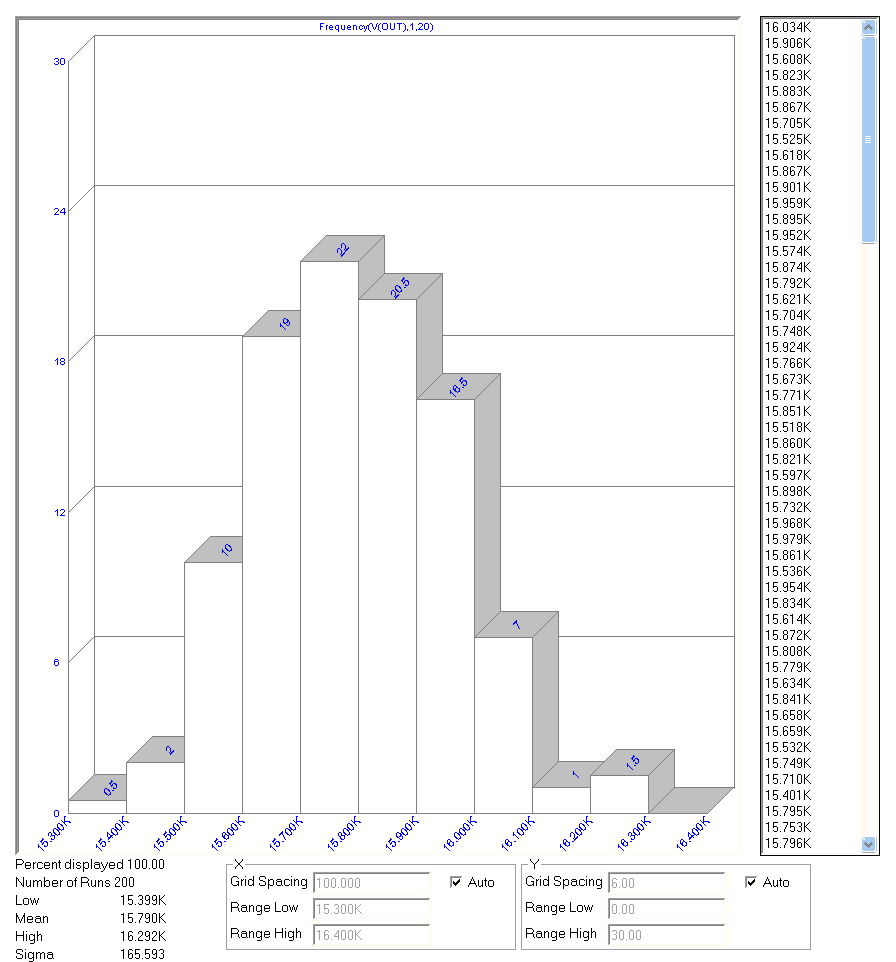
Performance functions are also used in Monte Carlo runs. Here is a version of the Wein bridge circuit that runs a Monte Carlo set of runs and plots a histogram of the frequency spread.


Monte Carlo plot using the frequency performance function


The function used is Frequency(v(OUT),1,25) and the simulation run is for 2ms.

The 200 runs produced a mean frequency of 15.772KHz with a standard deviation of 146.4 Hz. These numbers will change somewhat with each Monte Carlo run but the mean is fairly constant.

When the Harmonic Distortion analysis has finished, the Add Harmonic Distortion Window can be selected from the Harmonic Distortion / Harmonic Distortion Windows menu. Performance functions are important tools for measuring critical circuit function. Understanding their use will greatly enhance the user's ability to get the most from using Micro-Cap.

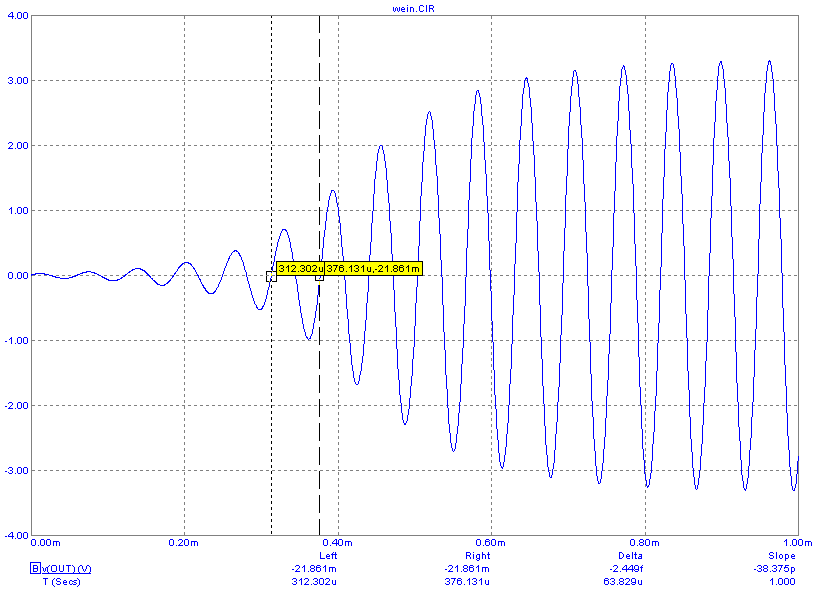
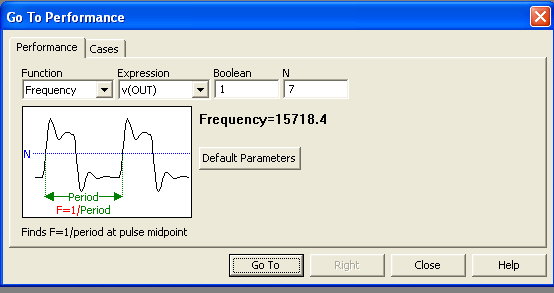
Performance functions are also used in the GoTo command. To illustrate we'll use the first Wein circuit again. Run transient and click on the Go To Performance button . This pops up the Go To Performance dialog box, from which you select the desired function. Pick Frequency and enter 5 in the N field. Click on the Go To button. The cursors are placed on the two data points of the 5'th frequency measurement. The measured frequency of about 15.66 KHz is printed in the dialog box. Click again and the N field is incremented to 6 and the 6'th frequency is measurement is displayed. The display should now look something like this:


Go To Performance frequency function

The dialog box shows the measured frequency. Each click of the Go To button increments the N value and finds the next measurement. The frequency value will change a little with each measurement until the circuit stabilizes.

Go To Performance dialog box

 
Download Winter 2013 Circuit Files
Return to the main Newsletter page


43