|
|
 |
Analysis Plot Labels
When stepping parameter values you will usually see an array of curves. How do you tell which curve
goes with which stepped value? You could invoke Cursor mode and use the up and down arrow keys
to cycle through the curves and watch the plot title reveal the stepped values. If you want a more permanent
delineation you can use labels. Here's a stepped plot without labels:
|
You can add labels that show the stepped values for each curve as follows. From the Scope menu select
Label Branches. This will display the Labels dialog box as shown below:
|
Click on the Automatically selected location option, then click on the OK button. This tells the program
to automatically select the label's X location based on the maximum vertical separation between
curves. This is usually close to optimal. If the selected location is a little off you can use the User
selected location by specifying the X coordinate for the labels. The next figure shows what the auto
option produces.
|
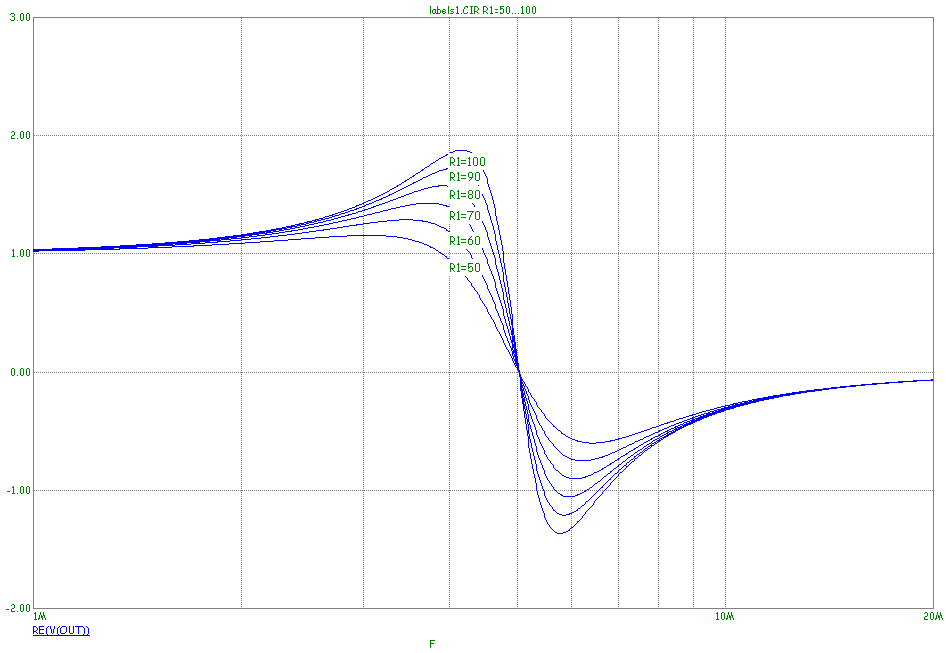
Here is the plot with User selected location set to 4e6. The location is in the units of whatever is plotted
horizontally, in this case frequency.
|
Branch labels are just text. Once placed they can be moved about, or as in this case, selected and deleted
to make room for the User selected location option.
|
Note that the color of the labels is initially the same as the waveform. Once placed the label color can
be changed. To do this you drag select the set of labels using the Select tool. Then you click on the
Color and or Font buttons to select a new font, size, and/or color. Here, for example, is the same run
with the font set to green 20 point Comic Sans.
|

|
Here are some things to remember when using branch labels.
1) Branch labels are ordinary text. Once placed they can be individually edited or deleted.
2) Branch labels are placed so that the text 'hangs down' from the specified X,Y point. The X coordinate
of the point is either automatically computed or entered by the user. The Y coordinate is the curve's Y value
at the specified X coordinate.
3) To quickly remove a set of labels, use CTRL+A to select all, then press the Delete key. This action
deletes all plot artifacts, including text and tags. To delete one set of labels, use the Select mode and
drag select the labels and then press the Delete key.
|
|
|
|
|


