|
|
 |
Using the N-Port Component
The N-Port component is a general device that has N ports characterized by a set of S-, Y-, G-, H-, T-, or ABCD-parameters that are contained in a standard
Touchstone data file. The Touchstone files are typically provided by RF suppliers who model the frequency response of a device through a table of values
in the file. The S-parameter data is the most common format used within Touchstone files.
The Touchstone data can be used to simulate the frequency response of any number of component types with examples such as inductors, transistors, SAW
filters, ferrite beads, and EMI filters available from EPCOS and On Semi.
The N-Port component can have any number of ports. Micro-Cap is distributed with four N-Port devices that simulate one port through four ports. These
devices are available in the Analog Primitives \ N-Port section of the Component menu. If more than four ports are needed, a new N-Port device would need
to be created in the Component Editor.
The N-Port component can greatly simplify a circuit for an AC analysis simulation. Rather than having to create an elaborate SPICE model of a device, the
N-Port component can be used as a black box to easily model the frequency response of the device.
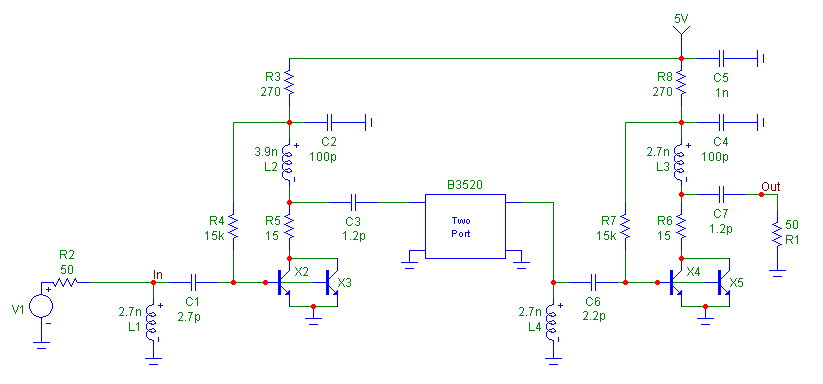
The schematic below displays an example of a circuit that uses an N-Port component to model a SAW (Surface Acoustic Wave) filter. The circuit was created
from an EPCOS application note (Ref 1). It models a GPS low noise front-end amplifier with a SAW filter. The structure of this circuit is based on a LNA
(Low Noise Amplifier) - Filter - LNA topology. The filter portion of the topology is represented by a Two-Port N-Port component that models the frequency
response of a B3520 SAW filter.
|

|
The N-Port component has one main attribute that needs to be defined. This is the FILE attribute which specifies the name and optionally the
location of the Touchstone file that is to be used to import the data from. In this circuit, the FILE attribute has been defined as follows:
FILE = B3520_WB.s2p
Since no path has been specified, the file should be located in the Data folder that has been specified in the Paths dialog box under the File menu. The
default path location is the DATA folder under the main Micro-Cap folder. The B3520_WB.s2p Touchstone file for the B3520 SAW filter was downloaded from the
EPCOS website. It consists of a table whose data values are in the S-parameter format. A portion of the file is displayed below.
					# MHz  S  MA  R  50
					!
					!  Freq            S11                 S21               S12              S22
					1075.750 9.475E-01 -159.23 4.729E-03   76.27 4.729E-03   76.27 9.207E-01 -164.49
					1078.250 9.481E-01 -159.46 4.975E-03   72.56 4.975E-03   72.56 9.217E-01 -164.71
					1080.750 9.464E-01 -159.75 4.706E-03   70.22 4.706E-03   70.22 9.177E-01 -164.77
					1083.250 9.475E-01 -159.93 4.664E-03   72.08 4.664E-03   72.08 9.198E-01 -165.08
					1085.750 9.466E-01 -160.17 4.906E-03   73.28 4.906E-03   73.28 9.214E-01 -165.22
					1088.250 9.465E-01 -160.39 5.142E-03   70.27 5.142E-03   70.27 9.221E-01 -165.44
					....
					....
					....
					2063.250 8.704E-01  158.89 1.467E-03   38.46 1.467E-03   38.46 8.503E-01  159.34
					2065.750 8.699E-01  158.94 1.358E-03   42.80 1.358E-03   42.80 8.504E-01  159.37
					2068.250 8.702E-01  158.79 1.281E-03   42.10 1.281E-03   42.10 8.505E-01  159.21
					2070.750 8.695E-01  158.67 1.268E-03   39.47 1.268E-03   39.47 8.491E-01  159.12
					2073.250 8.690E-01  158.47 1.077E-03   43.97 1.077E-03   43.97 8.495E-01  159.03
					2075.750 8.674E-01  158.47 9.509E-04   39.53 9.509E-04   39.53 8.497E-01  159.02
This file simulates the frequency response of the B3520 filter over a frequency range of 1075.75MHz to 2075.75MHz with a frequency step every 2.5MHz. During the
simulation, Micro-Cap will interpolate between the data points as needed. The data for each S-parameter is in a magnitude - angle pair. The S-parameters were
measured using a reference resistance of 50 ohms which is the real impedance to which the S-parameters were normalized to in the file.
Since the data within the Touchstone file is limited to a specific frequency range, the AC analysis will only be meaningful within this same range. If the frequency
simulated in the AC analysis is less than the frequency range in the file, then the data from the first data point will be used. If the frequency simulated is greater
than the frequency range in the file, then the data from the last data point will be used.
Note that Micro-Cap determines the number of ports that are being modelled by the Touchstone file through the extension of the file name. The extension format
should be:
.XnP
where X is the parameter type that is being used and n is a number that defines the number of ports that are being modelled in the file. For the B3520 file, the
extension is .S2P since it is a 2-port S-parameter file.
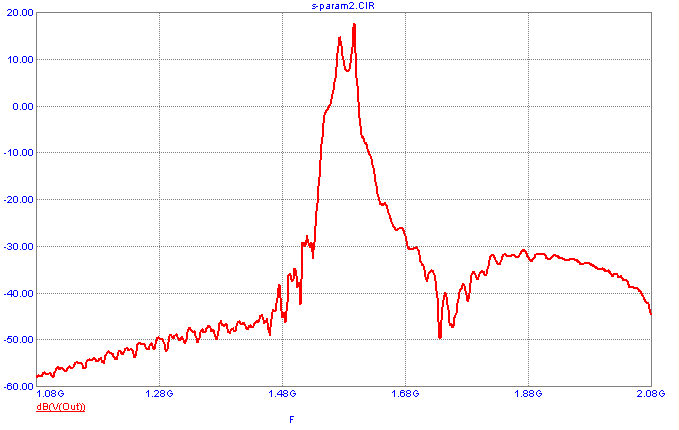
The AC analysis simulation of the GPS circuit is shown below. The simulation has been run over a frequency range of 1075.75MHz to 2075.75MHz which is the frequency
range of the data in the Touchstone file. The waveform displayed in the plot is the output voltage of the circuit in decibels which is plotted through the
expression:
dB(V(Out))
The L1 band of the GPS system, which covers civilian use, broadcasts at 1575.42MHz. As can be seen in the frequency response of the system, this frequency lands squarely
in the passband region of the output.
|

|
References:
1) EPCOS Application Note #16, "GPS low noise front-end amplifier with SAW filter B3520"
http://www.epcos.com/web/generator/Web/Sections/ProductCatalog/SAWComponents/AutomotiveElectronics/Resonators/PDF/PDF__AN16,property=Data__en.pdf;/PDF_AN16.pdf
|
|
|
|
|


