|
|
 |
Simulating an Audio Amplifier in Harmonic Distortion Analysis
The Harmonic Distortion analysis available in Micro-Cap applies a sinusoidal signal at the input of a circuit, steps frequencies and
amplitudes specified by the user on this signal, and then measures the resulting distortion at the specified load resistor.
If a pure, single frequency, sine wave signal is applied to the circuit input, and if the circuit is perfectly linear, the output will be a sinusoid at the
same frequency. The spectral content of the input and output will be the same except possibly in amplitude and phase. There will be no distortion.
If the circuit is not perfectly linear, some output signal level will be found at frequencies other than the input frequency. In other words, distortion will
occur. The Harmonic Distortion analysis is designed to simulate measurements such as THD, THD+N, SINAD, SNR, and the magnitudes of individual harmonics. For
distortion measurements such as IM2 and IM3, Micro-Cap has a separate Intermodulation Distortion analysis that can simulate these.
For Harmonic Distortion, a Sine source or a Voltage Source or Current Source of type SIN must be connected to the circuit input. Its frequency and amplitude
will be set by values from the Harmonic Distortion Analysis Limits dialog box.
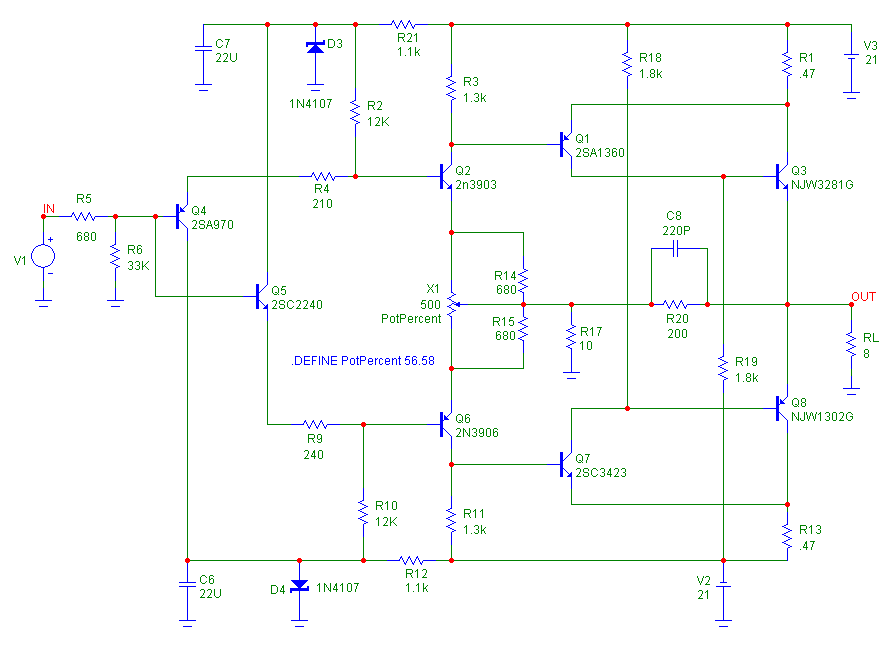
One area of engineering where harmonic distortion measurements are extremely useful is with audio amplifiers. The circuit below displays the Hiraga 20W
Class A amplifier (Ref 1) that will be used throughout this article to display the capabilities of the Harmonic Distortion analysis.
|
|
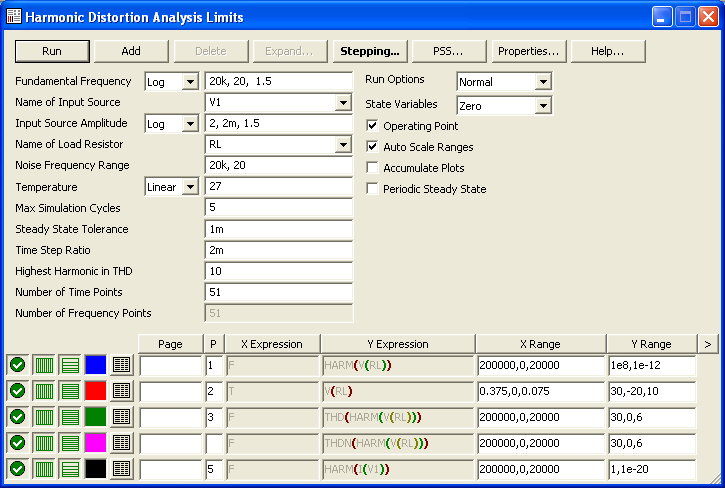
The Harmonic Distortion analysis can be entered by selecting Harmonic Distortion under the Analysis menu. The Harmonic Distortion Analysis Limits dialog box will
then appear in order to set the simulation settings for the run. The Limits dialog box appears below.
|
|
The fields unique to Harmonic Disortion analysis are:
Fundamental Frequency: This sets the frequency of the input source in the circuit. This frequency will also be used as the fundamental frequency in
the distortion calculations. The frequency can be stepped within this field with the standard log, linear, or list formatting or just a single value
can be used.
Name of Input Source: This specifies the name of the source that is to be used as the input.
Input Source Amplitude: This sets the amplitude of the input sine wave. The amplitude can be stepped within this field with the standard log, linear, or list
formatting or just a single value can be used.
Name of Load Resistor: This specifies the name of the load resistor used to measure the distortion.
Noise Frequency Range: This is the frequency range over which the noise will be measured for the THDN, SINAD, and SNR calculations.
The Periodic Steady State option in the limits is recommended for most simulations. This typically finds a more accurate result in less time. However, it is not
ideal for all cases. When the Periodic Steady State option is disabled, the following two fields are used.
Max Simulation Cycles: This is the number of periods each step will be run for. Micro-Cap will only use the last cycle for the distortion calculations.
Steady State Tolerance: If two successive cycles fall within this relative change tolerance then the simulation will finish early rather than simulating the maximum
number of cycles. Set this field to zero if you want the program to complete all of the Max Simulation Cycles.
Time Step Ratio: This controls the maximum time step as follows:
Maximum Time Step = Time Step Ratio/Fundamental Frequency
Highest Harmonic in THD: This specifies the largest harmonic that will be used when calculating the THD measurements.
A preset group of waveforms is specified in the waveform expression section of the Limits dialog box. These are waveforms that are necessary to perform the
distortion calculations. While the user can add their own waveforms into the dialog box, they cannot remove this set of waveforms, but they can choose whether
to plot them or not.
Upon running the simulation, any waveforms that have been enabled to plot are displayed in the Harmonic Distortion Analysis window. While this data is often of interest,
the real strength of the Harmonic Distortion is in the capabilities of the Harmonic Distortion Window performance plots which are used to mine data from the preset group
of waveforms specified in the Limits dialog box.
When the Harmonic Distortion analysis has finished, the Add Harmonic Distortion Window can be selected from the Harmonic Distortion / Harmonic Distortion Windows menu.
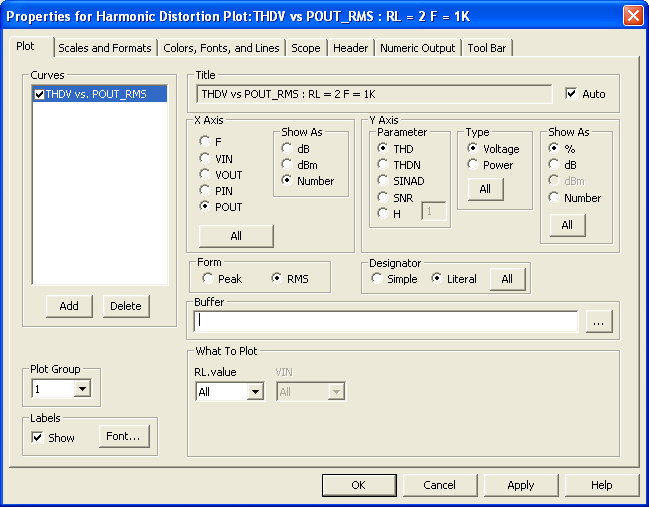
This command opens the Harmonic Distortion Window Properties dialog box shown below.
|
|
The Plot page of the Properties dialog box defines the plot(s) that will be displayed in the Harmonic Distortion Window. The X Axis section selects the variable
that will be plotted along the X axis. The following variables are available:
F - The fundamental frequency
VIN - The input voltage level
VOUT - The output voltage level
PIN - The input power level
POUT - The output power level
The Show As section chooses whether to plot the X axis variable in dB, dBm, or the value of the selected variable. Not all options are available for each
X-Axis variable.
The Y Axis section selects the variable that will be plotted along the Y axis. The following variables are available:
THD - Total harmonic distortion
THDN - Total harmonic distortion + noise
SINAD - Signal to noise and distortion ratio
SNR - Signal to noise ratio
Hn - The value of the n'th harmonic. The text field next to the H option controls the harmonic number. For example, if a 3 is entered in this field, then
the third harmonic will be plotted.
The Type section chooses whether the Y axis variable will be plotted as a voltage or power representation.
The Show As section chooses whether to plot the Y axis variable in %, dB, dBm or the value of the selected variable.
The Form section chooses whether the X and Y variables will be plotted using their peak values or their RMS values. For the Y axis variables, only the individual
harmonic plots will be affected by the RMS option since the other variables are all ratios.
The Designator section chooses how the Y variables will be labelled in the plot. The Simple option will designate the variable with just the basic variable name
such as THD. The Literal will create more complex names based on the selections such as THDV to designate that the THD is in voltage.
The Buffer field lets a waveform be imported into the plot from the Waveform Buffer.
The What to Plot section chooses which branch of a stepped variable will be chosen for the plot if more than one variable has been stepped.
Plot Group: This selects the plot group that the plot will be placed in.
Labels: When enabled, a text label will be placed in the plot that describes any individual stepped parameters that apply to the plot.
Except for the Numeric Output page, all of the other pages in the Properties dialog box operate in the same manner as they do in the other analyses. The Numeric
Output page will be described later in this article.
For the initial run of the Hiraga amplifier in Harmonic Distortion, the RL resistor is setup in the Stepping dialog box to step between the values of 2 ohms, 4 ohms,
and 8 ohms. These are the common load resistor values for audio amplifiers.
In the Harmonic Distortion Limits, the Fundamental Frequency field is set to 1kHz. The Input Source Amplitude field is set to:
2, 2m, 1.5
with the Step method chosen as Log. The remaining settings are set as shown in the Limits dialog box previously. The data generated in the Harmonic Distortion
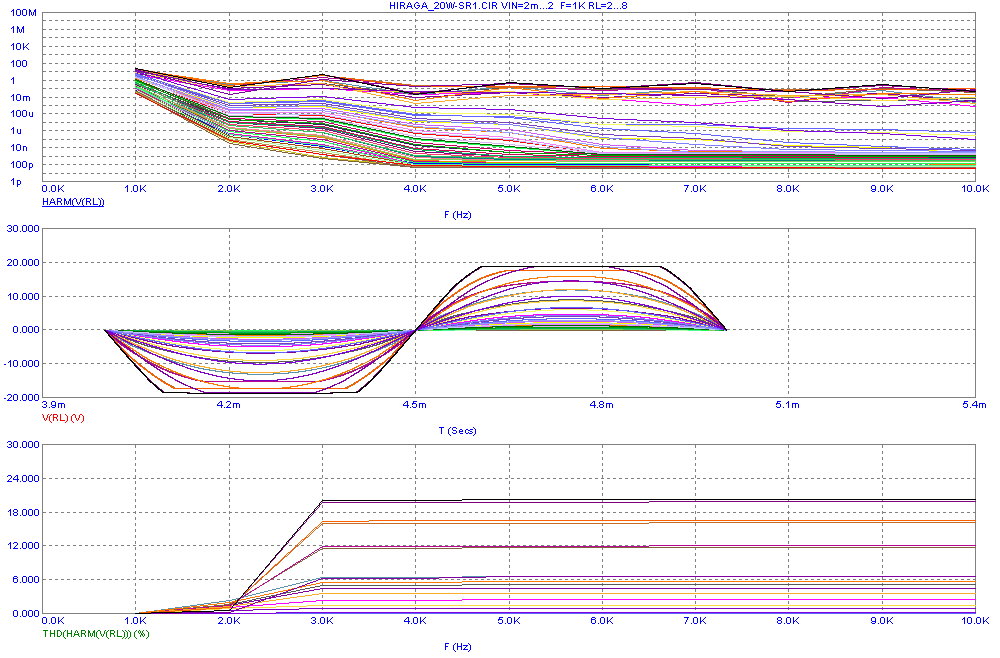
Analysis window is shown below.
|
|
The top plot displays the harmonics produced at the voltage output of the amplifier across the RL resistor. The middle plot displays the actual voltage at the load
resistor. Note the clipping that is occurring at the higher voltage outputs. The bottom plot displays the total harmonic distortion of the output. With the amplitude
of the input source and the load resistor both being stepped, there are 57 branches for each of the waveforms. This is an abundance of data and the reason why the
Harmonic Distortion Plots are so valuable in distilling all of this data into simpler plots.
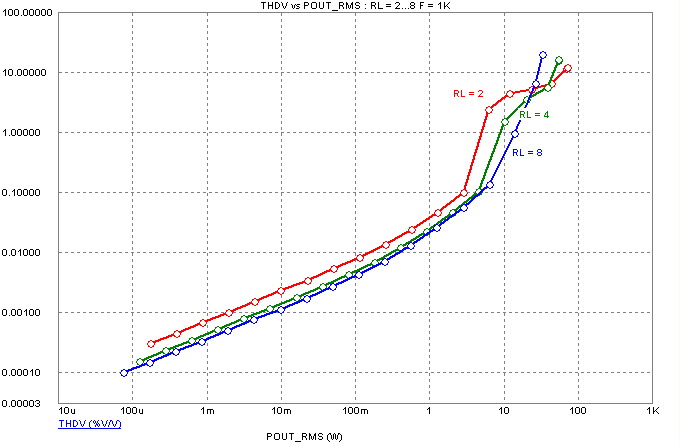
The first Harmonic Distortion Plot created from the above simulation is shown below. This plots the THD versus the output power of the amplifier for each of the three
steps of the load resistance. The THD value is in percentage while the output power is in RMS Watts. Note that all THD calculations in these Harmonic Distortion Plots
will use only the first ten harmonics as that is the value set in the Highest Harmonic in THD field in the Limits dialog box. As expected, the THD increases as the
power increases.
|
|
The second Harmonic Distortion Plot is shown below. This plots the 2nd, 3rd, 4th, and 5th harmonics of the output voltage versus the output power for the instance
when the load resistor is set to 2 ohms. Each of the harmonics are plotted with their RMS values in decibels while the output power is in RMS Watts. The harmonics
for the instances where the load resistance is 4 ohms or 8 ohms could also have easily been plotted in the same window or a separate window.
|
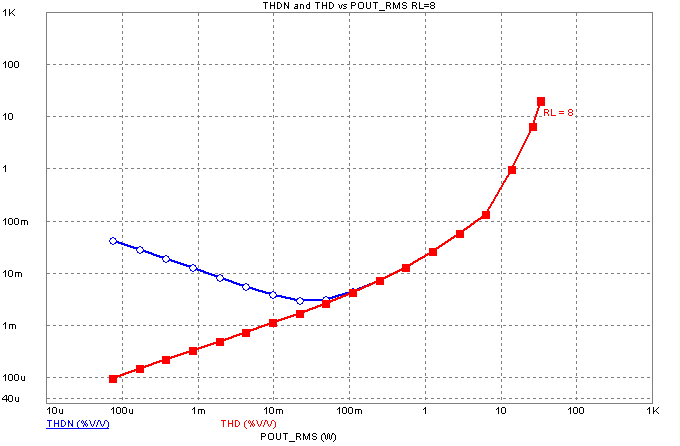
The third Harmonic Distortion Plot for this simulation is shown below. This plots the THD+N and THD versus the output power of the amplifier for the instance
when the load resistor is at 8 ohms. Both of the distortion plots are plotted in percentage, and the output power is again in RMS Watts. As can be seen in the
plot, the noise dominates the distortion when the amplifier is operating at low power but has a negligible effect when the amplifier is operating at higher power.
|
|
For the next simulation run on the Hiraga amplifier, the Fundamental Frequency field in the Harmonic Distortion Limits dialog box is set to:
200k, 20, 1.2
with the Step method set to Log. The Input Source Amplitude is set to 260mV. The amplitude is defined with a value that will not cause any clipping at the amplifier
output. The remaining settings stay the same.
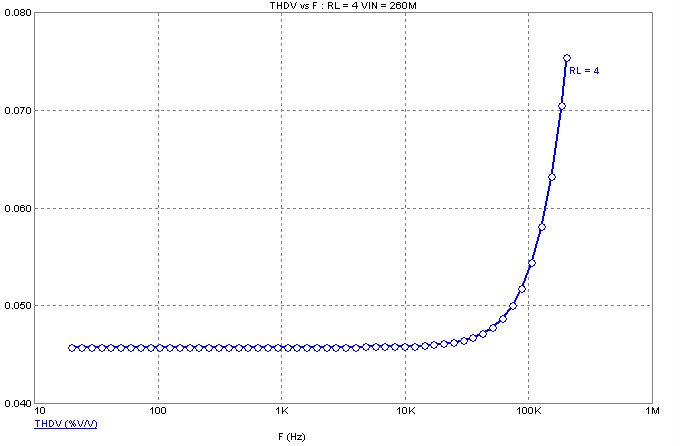
The Harmonic Distortion Plot shown below is created from the new simulation. This plots the THD versus the fundamental frequency of the input signal when the
load resistance is at 4 ohms. The THD is in percentage and the frequency is in Hz. The Hiraga amplifier is an exceptionally linear amplifier. At 20Hz, the THD is at
.045%, and at 200kHz, the THD has only risen to .075%.
|
|
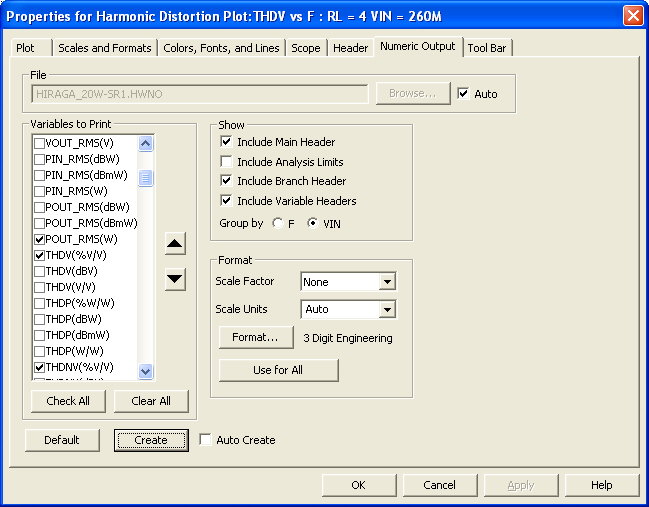
While the Harmonic Distortion Plots provide a good visual representation of the data, the numeric output capability of these plot windows can also be used to provide
a useful table of values. The Numeric Output page of the Harmonic Distortion Window Properties dialog box is displayed below. This dialog box can be invoked by double
clicking or hitting F10 in any Harmonic Distortion Plot window.
|
|
All of the Harmonic Distortion Plot variables are available for the numeric output whether they are being plotted or not in the window. The input
variables (F, VIN, VOUT, PIN, and POUT) along with the output variables (THD, THDN, SINAD, SNR, and Hn) can all be printed in a single table. The Hn
values are available for the first through the ninth harmonics. The list in the Variables to Print section displays all of the configurations for the
variables that can be printed. A check in the checkbox enables that variable for the numeric output file. Each variable is labelled with their literal
name along with their units. Some examples:
VOUT_RMS(dBV) - Prints the RMS output voltage in dBV
SNRP(dBmW) - Prints the signal to noise ratio of the power in dBm
H3V(%V/V) - Prints the voltage value of the third harmonic in %
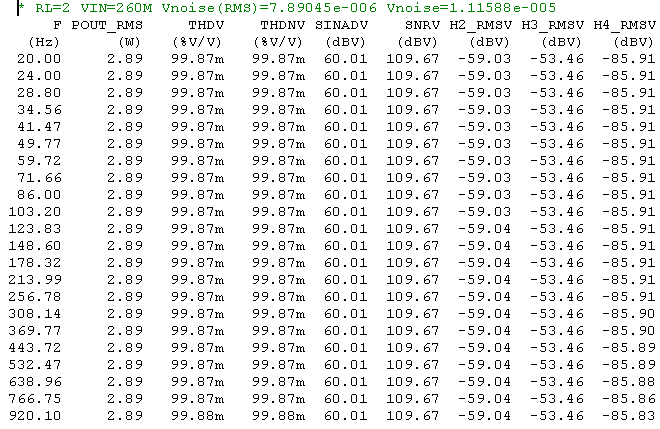
Once the appropriate waveforms are enabled, clicking the Create button will create the numeric output file. A sample file created from the second Hiraga
simulation where the frequency was stepped is shown below. The table shows the specified expression values for each fundamental frequency that was stepped
in the simulation. In this case, the RMS output power, THD, THDN, SINAD, SNR, second harmonic, third harmonic, and fourth harmonic values are all included
in the table. Note the comment at the top of the table that describes the parameter values of the simulation step for this table along with the noise value
that was calculated for this circuit and is used in the THDN, SNR, and SINAD calculations. The noise value is calculated across the bandwidth specified by
the user in the Noise Frequency Range field in the Limits dialog box which in this case is between 20Hz and 20kHz.
|
|
Many thanks to Sigurd Ruschkowski for helping in the development of this article.
References:
1) "Construction of a 20W Class A Amplifier 3 - The final version", Jean Hiraga and Gerard Chretien, http://www.tcaas.btinternet.co.uk/hiraga3.htm
|
|
|
|
|


