|
|
 |
Limiting Phase Plots to +/- 180 Degrees
The PH(z) function in Micro-Cap is used in AC analysis to plot the phase in degrees of the specified
complex expression z. When plotting, this function checks the history of the phase plot in order to
make the waveform continuous. For example, when the phase is at -179 degrees and then crosses back
into the second quadrant, the phase value may be specified as either -181 degrees or +179 degrees.
The PH(z) function selects -181 degrees as the value to plot to prevent large discontinuities in the
waveform. However, since both values are valid, some users may want to display the phase with the
values limitied to +/-180 degrees. This function can be easily plotted by using the macro capabilities
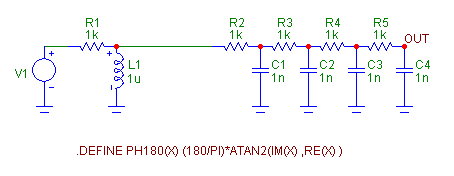
of the define statement. In order to demonstrate this, the simple passive network below will be
simulated in AC analysis.
|

|
The object of interest in this schematic is the define statement. This define statement
creates a function to calculate the phase as follows:
.DEFINE PH180(X) (180/PI)*ATAN2(IM(X) ,RE(X) )
The ATAN2 function calculates the inverse tangent value of the ratio of the imaginary value
of the expression X versus the real value of the expression X. The ATAN2 function output is
limited to values between PI and -PI. The inverse tangent value calculated is equivalent to
the phase value of the expression X in units of radians. The radian value is then multiplied
by the constant 180/PI to convert it into units of degrees. Since the ATAN2 function is
limited to +/-PI, the equivalent limit in degrees will be +/-180.
Once this define statement is entered in the schematic file, the specified function PH180(X)
is now available to be used in the AC Analysis Limits dialog box. This function would be used
in the same manner as a function that is hardcoded in Micro-Cap. For example if you wanted to
plot the phase of the voltage at node Out, the following expression would be entered in the Y
Expression field:
PH180(V(Out))
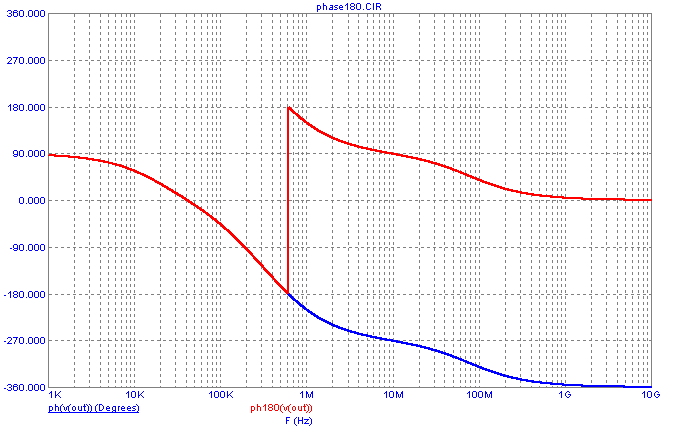
An AC analysis is run on this schematic in which both the PH180(V(Out)) expression and the
standard PH(V(Out)) expression are plotted. The resulting simulation is show below.
|

|
The two phase plots track each other exactly up until the point at which the phase crosses the
-180 degree level. At that point the PH180 function transitions back up to the +180 degree
level. The two plots then continue 360 degrees apart for the rest of the simulation.
The define statement for the PH180 function has to be accessible by the schematic. Rather than
copying it into every schematic though, it can instead by placed into the Mcap.inc file. The
Mcap.inc file is a file in the main Micro-Cap folder that contains a list of statements that
are automatically included with every schematic. This file can be accessed within Micro-Cap by
selecting the User Definitions option under the Options menu.
|
|
|
|
|


