|
|
 |
Optimizing NTC Thermistor Coefficients
A thermistor is a thermally sensitive resistor that adjusts its resistance with changes in temperature
in a predictable manner. Thermistors are used for such applications as temperature measurement, temperature
control, power measurement, amplitude stabilization, and timing circuits. The NTC type of thermistor
has a negative temperature coefficient whose resistance decreases with an increase in temperature. The
behavior of an NTC thermistor can be modeled accurately through the Steinhart-Hart equation which is as
follows:

where

T is the temperature in Kelvin. A, B, and C are the three coefficients that need to be calculated in
order to produce an accurate resistance versus temperature model. The optimizer available in Micro-Cap
provides a great way to determine the appropriate value of these constants. The schematic below can be
used with the optimizer to determine the Steinhart-Hart coefficient values.
|

|
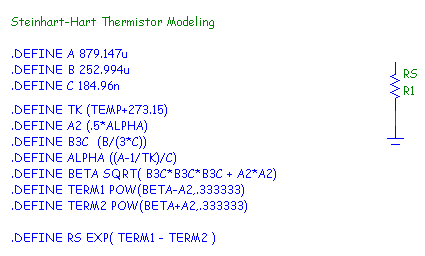
The only components in the schematic are a resistor and a ground. The ground is present
because it is mandatory for a ground node to be present in all schematics. The resistor
has its RESISTANCE attribute defined with the symbolic variable RS. The RS variable is
defined through the use of eleven define statements. These define statements reproduce
the Steinhart-Hart equation shown above. The A, B, and C symbolic variables must each
have their own define statement since these are the objects that will be optimized. The
other define statements were used to help enhance the readability of the expression rather
than having one long define statement. The define statements used are as follows:
.DEFINE A 1m
.DEFINE B 200u
.DEFINE C 100N
.DEFINE TK (TEMP+273.15)
.DEFINE A2 (.5*ALPHA)
.DEFINE B3C (B/(3*C))
.DEFINE ALPHA ((A-1/TK)/C)
.DEFINE BETA SQRT( B3C*B3C*B3C + A2*A2)
.DEFINE TERM1 POW(BETA-A2,.333333)
.DEFINE TERM2 POW(BETA+A2,.333333)
.DEFINE RS EXP( TERM1 - TERM2 )
Since the curve that is to be optimized is a resistance versus temperature curve, the best
analysis to optimize this in is the DC analysis. The DC Analysis Limits dialog box is setup
as below.
|

|
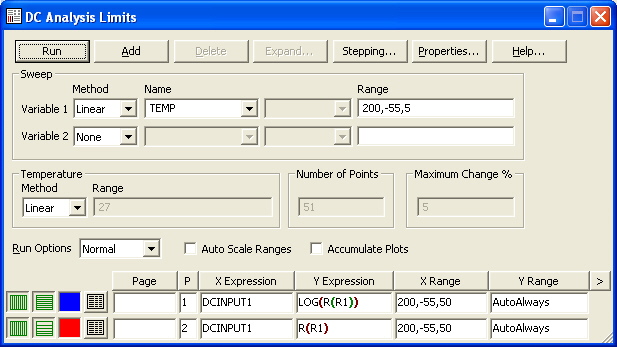
The Temp operator is entered in the Variable 1 field, and the temperature has been setup to be
swept linearly from -55C to 200C in 5C increments. Two Y expressions for the resistance are
plotted versus the swept temperature. The value of the resistance of the R1 resistor is plotted
as R(R1), and the logarithmic value of the resistance is plotted as Log(R(R1)).
The optimizer can only operate on waveforms specified in the analysis limits dialog box. While
NTC thermistor data sheets will describe the device in terms of the resistance versus temperature,
the optimizer will produce more accurate results with its logarithmic equivalent. When matching
a curve, the optimizer works better when the values it is trying to match are of similar magnitude
since each data point has equal weighting. Specifying both of these expressions in the analysis
limits lets the user compare the resistance versus the data sheet while also letting the optimizer
work with the log expression.
The optimizer in DC analysis is accessible through the Optimize command under the DC menu. It
specifies the parameters to be optimized along with the criteria to optimize to. For the NTC
thermistor example, the Optimize dialog box has been set up with the following information.
|

|
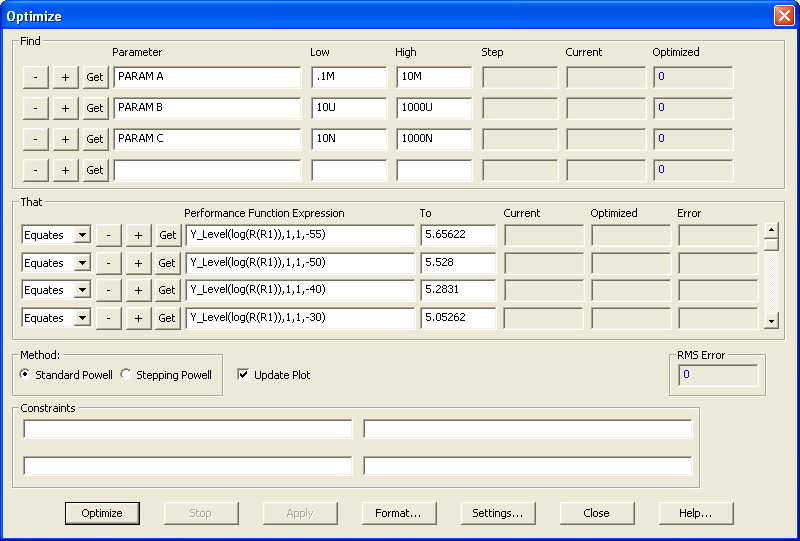
The Find section specifies the A, B, and C parameters as the objects to be optimized along with a
low and high value that defines the range that the value of these parameters may be optimized within.
The That section defines the curve that the optimizer is trying to match. In order to match a curve,
the Equates option should be used in conjunction with the Y_Level performance function. Each data
point in the curve would be defined using an Equates - Y_Level entry. For this example, the thermistor
data that will be used is for the B57885S0103F002 thermistor from Epcos which has a nominal resistance
of 10kohms at 25C. This particular data point in the resistance versus temperature curve would be
defined with the following performance function expression:
Y_Level(log(R(R1)),1,1,25)
where the corresponding To field would be set to 4 since that is the log equivalent of 10k. This entry
tells the optimizer to try to match the log(R(R1)) expression to a value of 4 at the specified X axis
value (temperature) of 25. Other resistance/temperature data pairs for the device from a range of -55C
to 155C have also been entered in the That section to produce a good sampling of the thermistor curve.
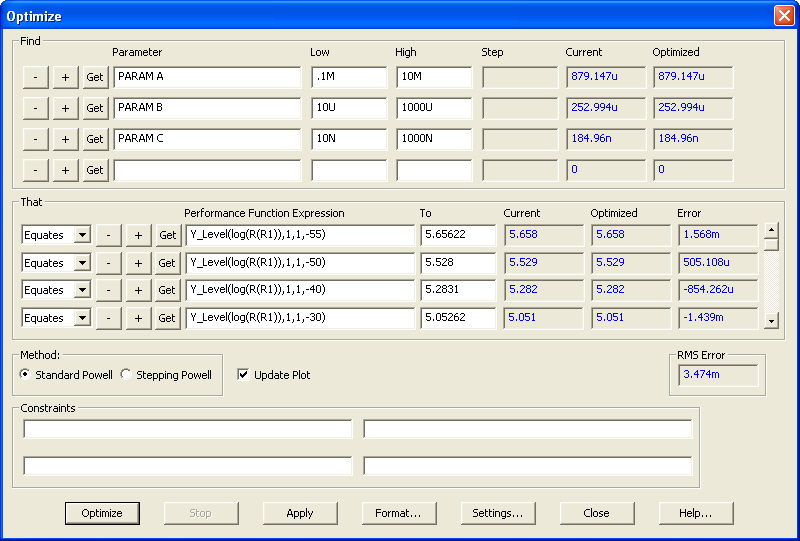
Clicking the Optimize button initiates the optimization process. The final results for this particular
optimization are shown below.
|

|
Hitting Apply in the Optimize dialog box modifies the parameters in the schematic with the optimized
values that were calculated. Running DC analysis plots the optimized curve which is shown below.
The left cursor has been set to show that the resistance value is now 10kohm at 25C.
|
|
|
|
|


