|
|
 |
3dB Point Performance Plots
The 3dB reference point is a common reference frequency that is used when evaluating the
frequency response of a filter. This reference point is defined as the frequency at which
the gain drops to .7071 (1/sqrt(2)) of the passband gain. The 3dB point can be used to
determine the bandwidth, cutoff frequency, and half power frequency among other measurements
depending on the type of filter being simulated.
For a single simulation waveform, the 3dB point can be determined by plotting the dB
waveform of the output in AC analysis. When the analysis finishes, enter Cursor mode, and
move one of the cursors until it is 3dB below the value specified in the passband gain in
order to view the 3dB point frequency. However, when using stepping or Monte Carlo to
create multiple waveform branches, determining the 3dB point with this method can be time
consuming. The performance plot capability of Micro-Cap provides a quick way to view the
3dB points for all of the branches in a single plot. The performance plots are designed
to extract circuit performance measurements from curves generated during an analysis. It
will extract one measurement from each branch and then plot that measurement versus the
parameter that varied during the simulation. Since there is not a performance operator
designed for directly determining the 3dB point, this article describes how to use a
combination of two performance operators to produce the appropriate plot.
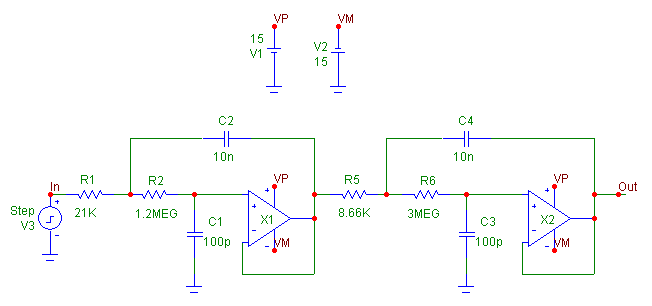
The schematic below was created through the Active Filter Designer available within
Micro-Cap. It is a low pass Butterworth filter that uses the Sallen-Key circuit
configuration for both stages. The filter is designed to have a passband gain of 0dB.
The opamp models within the filter have their Level parameters set to 1 so that the opamp
model used is a simple voltage-controlled current source with a finite output resistance
and open loop gain.
|

|
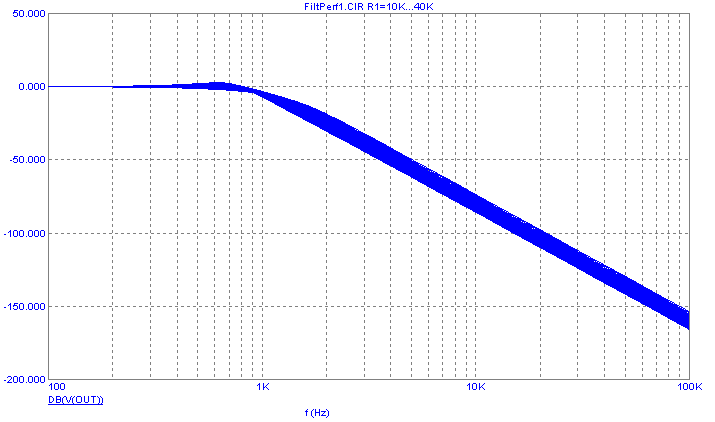
The AC frequency response for this filter is shown below. The waveform being plotted is the
decibel magnitude of the voltage at node Out defined as DB(V(OUT)). For this example, the
resistor, R1, at the input to the first stage is being stepped from 10kohm to 40kohm in 1000
ohm increments which produces a total of 31 stepped waveforms. Once the simulation finishes,
a performance plot can be created to harvest the 3dB data.
|

|
The performance plot can be created by going to the AC menu, clicking on Performance Windows,
and then selecting Add Performance Window. A shortcut to this command can be accessed by right
clicking on the DB(V(OUT)) expression in the AC plot, and selecting Add Performance Window on
the menu that appears. To extract the 3dB information, the performance plot will use an
expression which is a combination of the X_Level and Y_Level performance operators. The
X_Level operator has the following syntax:
X_Level(Expression,Boolean,N,Y Level)
The X_Level operator returns an X value at a specified Y value. The Expression field needs
to be one of the expressions plotted during the simulation. The Boolean field defines a
boolean expression that determines the portion of the specified expression that the performance
operator will take its measurement from. The N field is an integer field that defines which
instance will be found and measured. The Y Level field specifies the Y value at which the X
value will be measured. The Y_Level operator has the following syntax:
Y_Level(Expression,Boolean,N,X Level)
The Y_Level operator acts in the same manner as the X_Level operator except that a Y value is
returned at a specified X value. The only field that is different is the X Level field which
is used to specify the X value at which the Y value will be measured.
For the AC simulation from the low pass Butterworth filter example circuit, the X_Level and
Y_Level operators will be combined as follows in order to measure the 3dB point frequency
versus the resistance that was varied.
X_Level(DB(V(OUT)),1,1,Y_Level(DB(V(OUT)),1,1,100)-3)
The X_Level operator is measuring the DB(V(OUT)) expression. The Boolean field has been set
to 1 which means that the operator can work over the entire simulation, and the N field has
been set to 1 so that the first instance of the measurement will be returned. The Y Level
field for the X_Level operator is defined as:
Y_Level(DB(V(OUT)),1,1,100)-3
This Y_Level specification will return the Y value of DB(V(OUT)) at a frequency of 100Hz which
provides a measure of the passband gain for this filter response. This passband gain value is
then subtracted by three to produce the 3dB value at which the frequency will be measured.
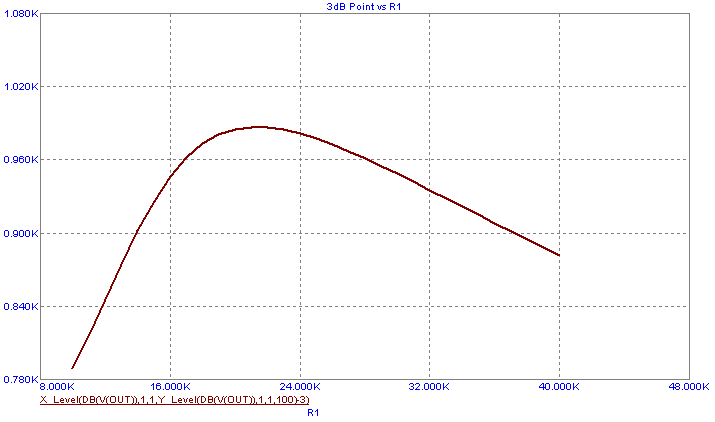
The final output of the full expression is the frequency value at which the output gain is 3dB
below the passband gain which is the definition of the 3dB point frequency. When using this
technique, each step of the AC simulation would need to have a common frequency at which the
passband gain can be measured. The result of this performance plot expression is displayed
below which shows the 3dB point frequency values being plotted versus the resistance
values of the R1 resistor for the Butterworth filter example.
|

|
|
|
|
|


