|
|
 |
Measuring S-Parameters
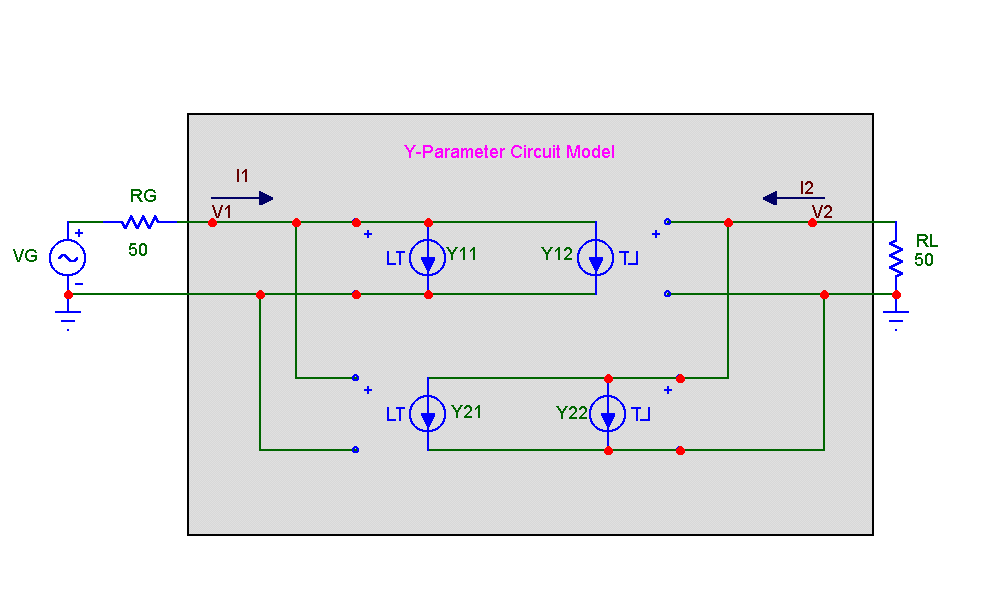
In this section we show how to measure the S-parameters of any two-port network. S-parameters are defined with respect to the two-port network of the figure below as:
b1 = S11*a1 + S12*a2 (1)
b2 = S21*a1 + S22*a2 (2)
Assuming that R0 is purely real,
a1 = Normalized incident voltage at port 1=(V1+R0*I1)/(2*sqrt(R0)) (3)
a2 = Normalized incident voltage at port 2=(V2+R0*I2)/(2*sqrt(R0)) (4)
b1 = Normalized reflected voltage at port 1=(V1-R0*I1)/(2*sqrt(R0)) (5)
b2 = Normalized reflected voltage at port 2=(V2-R0*I2)/(2*sqrt(R0)) (6)
|

|
S11 is measured when a2=0, so
S11=b1/a11=(V1-R0*I1)/(2*sqrt(R0))/(V1+R0*I1)/(2*sqrt(R0))=(V1-R0*I1)/(V1+R0*I1) (7)
From Kirchoff's Law at port 1.
-VG + R0*I1 +V1 = 0 (8)
Assuming VG=1, and solving (7) and (8) we get,
S11 = 2*V1-1 (9)
Similarly, we can solve for the remaining S12, S21, and S22 to get
S21 = 2*V2
S12 = 2*V1
S22 = 2*V2-1
Measurement procedure
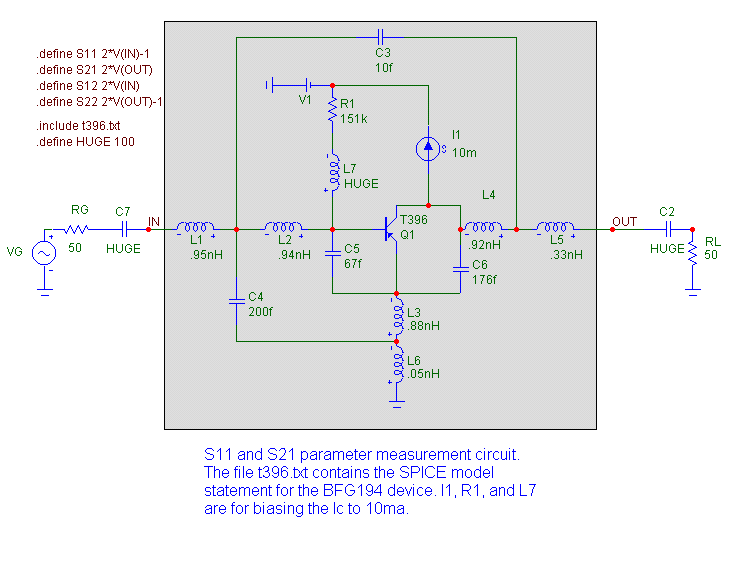
1) Set up the test circuit with bias circuitry to properly bias the device. Add large (10-100) value inductors or capacitors as needed to provide the necessary short or open circuits for the biasing circuitry. Make sure that the isolating inductors and capacitors do not affect the high frequency measurements. The inductors should be in series with the bias circuitry and the capacitors should be in series with the input and output signal paths.
2) To measure S11 and S21, drive the input port through a resistor of R0 with a source having an AC magnitude of 1.0. Place an R0 resistor across the output port. R0 is normally 50 ohms.
3) To measure S22 and S12, drive the output port through a resistor of R0 with a source having an AC magnitude of 1.0. Place an R0 resistor across the input port.
4) Add the text labels "IN" and "OUT" at the input and output nodes.
5)Add the following define commands to the circuit.
.define S11 2*V(IN)-1
.define S21 2*V(OUT)
.define S12 2*V(IN)
.define S22 2*V(OUT)-1
6)Run AC analysis. To plot the magnitude and phase of S11, plot S11 and PH(S11). Plot the other parameters similarly.
Here for example, is the Siemens BFG194 device, together with its package parasitics, embedded in the circuitry needed to measure the S11 and S21 parameters.
|

|
|
Figure 14 shows the plot of the S11 and S21 parameters for the BFG194 device.
|
|
Here is the same Siemens BFG194 device, together with package parasitics, embedded in the circuitry needed to measure the S22 and S12 parameters.
|
|
Figure 16 shows the plot of the S22 and S12 parameters for the BFG194 device.
|
|
|
|
|


