|
|
 |
Plotting Gain and Phase in Harmonic Distortion
A new feature has been added to Harmonic Distortion to facilitate RF designs. The feature is included
in 10.0.9.0 and can be downloaded from the MC10 Help menu / Check for Updates...
GAIN = H1 / VIN, where VIN is the amplitude of the applied input sinusoid.
PHASE = ATAN(IMAG(H1)/REAL(H1)) - ATAN(IMAG(VIN)/REAL(VIN))
Since VIN is a sine wave,
PHASE = ATAN(IMAG(H1)/REAL(H1)) - 90.00
GAIN is defined as the ratio of H1 (1'st harmonic of V(RL) to VIN.
PHASE is defined as the phase difference between V(VIN) and V(RL).
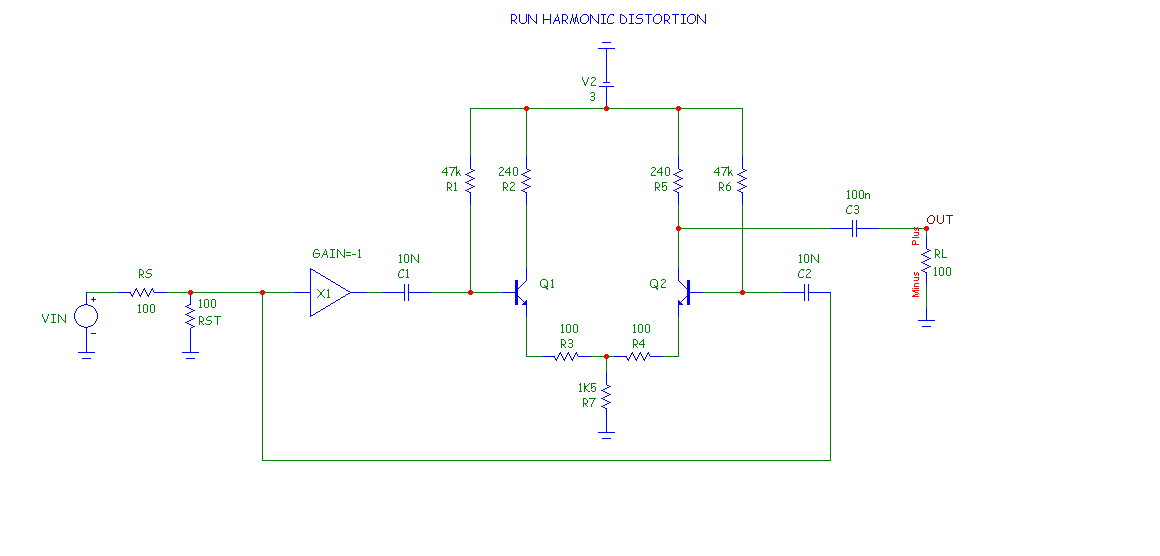
To illustrate, we'll run the new plots on this circuit:
|

|
Select Harmonic Distortion analysis. The Analysis Limits dialog box looks like Figure 2.
The only new item is Name of Source Resistor. Naming the source resistor serves the same purpose
as in Intermodulation Distortion; it allows the input power to be calculated as
PIN = (VIN/2)*(VIN/2)/RSOURCE, a common RF definition for input power.
As in Intermodulation Distortion, if the source resistor is unnamed then input power is defined as
PIN = VIN*IIN
|
Click on the Harmonic Distortion Plot window and then press F10 to display its new Properties
dialog box. There are only two new items, Gain and Phase. They are located at the bottom of the list
of available Y-Axis Parameters. The dialog box looks like this:
Here we're plotting gain (blue) and phase (red). Gain is the ratio of H1 (1'st harmonic of V(RL)) to
VIN and Phase = ATAN(IMAG(H1)/REAL(H1)) - 90.00. Press F2 to start the run. The completed
plot looks this.
|
You can plot gain or phase separately, or as in this plot, they can be plotted together using two
separate scales.
This type of plot is especially useful in RF amplifiers. It shows gain compression in the amplifier
much more directly than a plot of H1 vs. PIN. Gain compression is a type of distortion caused by
the reduction in differential gain at higher input power. It is due to the nonlinearity of the amplifier's
transfer function.
|
|
|
|


