|
|
 |
Comparing Analysis Modes
Have you ever wondered how transient analysis compares with AC analysis or DC analysis? They are
in fact consistent even though they each measure something somewhat different.
Transient analysis gives time domain waveforms which are plots of voltage or current versus time.
AC analysis gives the voltage or current versus frequency in a linearized version of the circuit.
DC analysis gives DC voltage or current, usually versus a stepped voltage or current.
In principle, each analysis should give results that agree with the others, if looked at correctly. If we
apply a very small sinusoid to a transient analysis run and compare the amplitude of the output voltage
with the value we get in AC analysis, they should be the same. Similarly, if we compare the low frequency
gain of AC analysis with the DC gain at the same zero-input bias, we should get the same value.
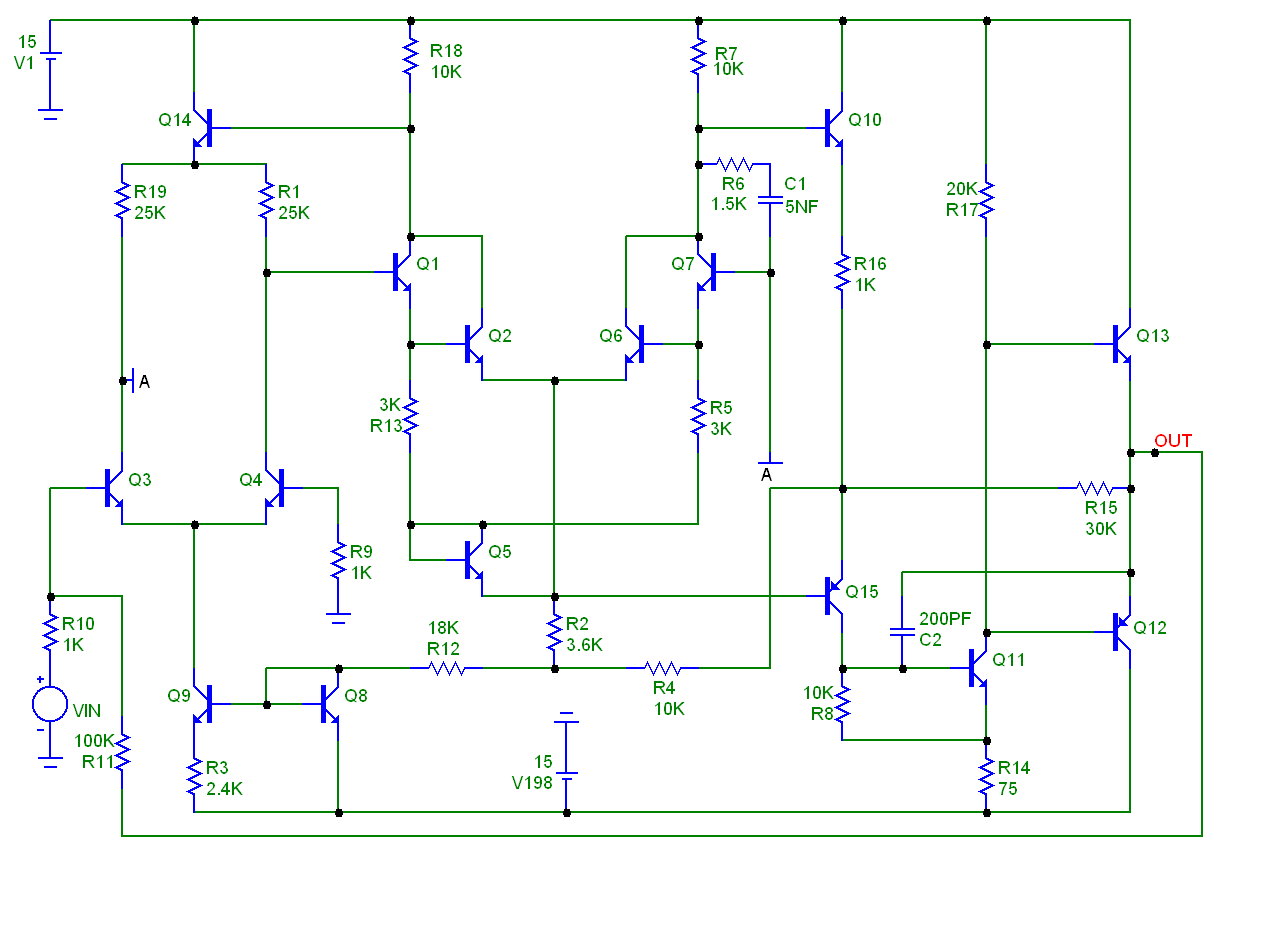
Let see if we do. Here is a schematic of an opamp, configured to have a gain of about 100 at low
frequency.
|

|
The input signal is a 1mV, 1KHz sinusoid. 1mV is small enough so that the opamp produces a near
linear response. The resulting transient analysis is shown in Figure 11. The top plot shows the voltage
and current of the input voltage source. The bottom waveform shows the response at the output node.
The gain is measure with a Peak_Valley performance function, embedded in a piece of formula text.
It looks like this
Gain = Peak_Valley(V(OUT),1,2)/2m = [Peak_Valley(V(OUT),1,2)/2m]
|
The Peak_Valley function measures the distance from the 2'nd peak to the 2'nd valley and divides the
result by the peak-to-valley distance of the 1mV input source (which is 2mv). If you didn't know this
value, you could alter the formula to measure it as well, like this
Peak_Valley(V(VIN),1,2)
So the result is that the gain at 1KHz as measured in transient analysis is about 98.722. Let's see how
that compares with what we get in AC analysis.
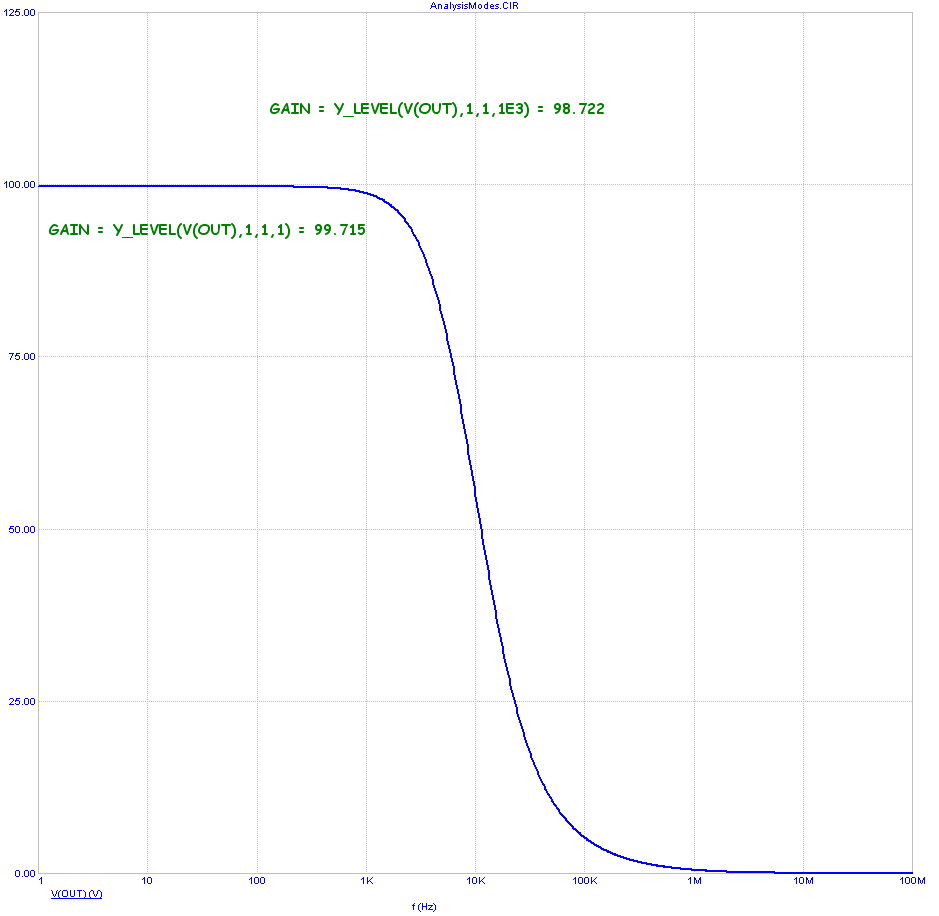
Here is the AC analysis run.
|

|
The analysis shows a plot of the voltage at the output node. The input voltage is the default 1.0V, so
the plot is also a plot of the input to output gain. Again we use a performance function to measure
the gain at 1KHz. The formula text used to do this is
GAIN = Y_LEVEL(V(OUT),1,1,1E3) = [Y_LEVEL(V(OUT),1,1,1E3)]
The result is 98.722. This is the same result we got in transient analysis to within five decimal places.
Notice that we used another performance function to measure the gain at low frequency. It looks like
this
GAIN = Y_LEVEL(V(OUT),1,1,1) = [Y_LEVEL(V(OUT),1,1,1)]
The resulting gain at low frequency is 99.715.
Here we measure the value of V(OUT) at F=1, the lowest frequency of the AC analysis. If we wanted
a more accurate result, we might use a low frequency of .001Hz and then modify the performance
function as follows:
GAIN = Y_LEVEL(V(OUT),1,1,.001) = [Y_LEVEL(V(OUT),1,1,.001)]
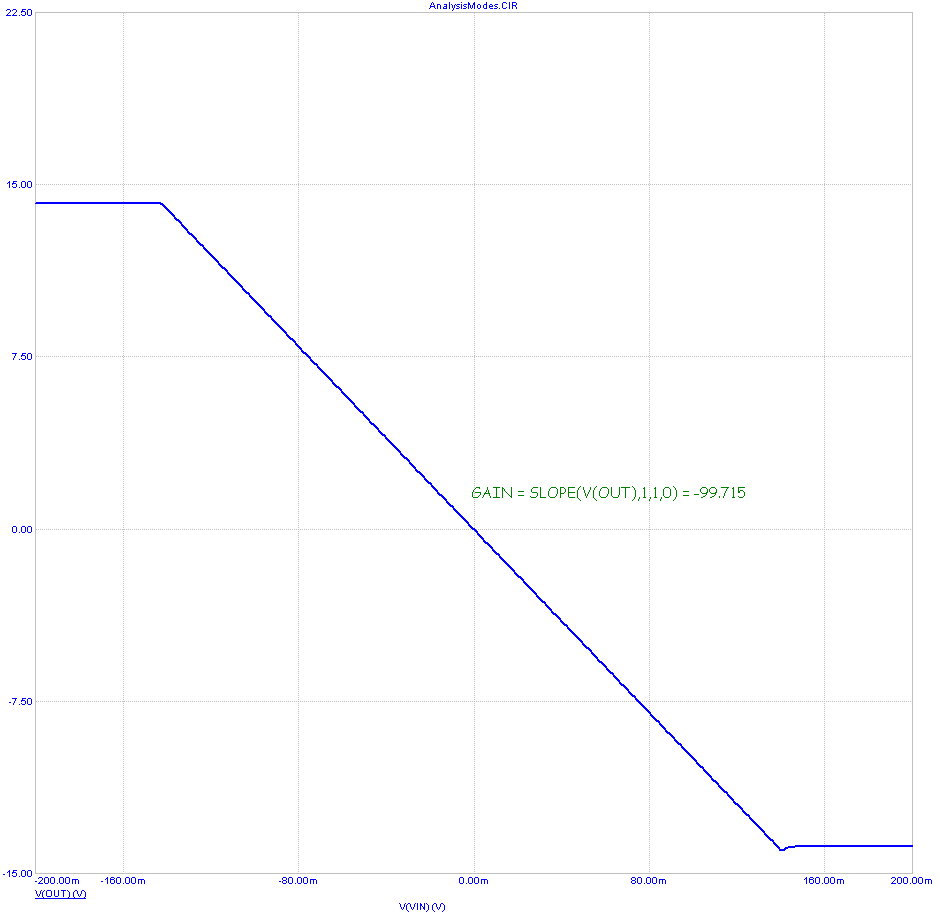
Now lets see if this matches what we see in DC analysis. It looks like this:
|

|
In this analysis we sweep the input DC voltage and measure the output voltage. As expected, we see
saturation for any voltage whose magnitude is larger than about 140mV. The gain at zero input voltage
bias (the same DC bias used in AC analysis) is measured with a performance function like this:
GAIN = SLOPE(V(OUT),1,1,0) = [SLOPE(V(OUT),1,1,0)]
The gain is measured directly with the SLOPE function when the swept input DC voltage is zero. The
result is a gain of -99.715. Except for the sign, this is the same result obtained in AC analysis.
|
|
|
|
|


