|
|
 |
Diode If vs Vf Temperature Modeling
For many SPICE models, temperature modeling has not been optimized. The temperature parameters that affect the characteristic curves of
the model are typically left at their default values which may not be accurate for simulations whose temperature setting deviates from
the temperature that the model's parameters were optimized at. Most device models are optimized at either 25 or 27 degrees Celsius which
is considered room temperature. The circuit optimizer that is available in transient, AC, or DC analysis for Micro-Cap can be used to
derive the temperature parameter values for more accurate simulation results.
For the basic forward current versus forward voltage curve of a diode, the three primary temperature parameters in the diode model are XTI,
TRS1, and TRS2. XTI is the saturation current temperature coefficient and is used to change the diode saturation current sensitivity. The
TRS1 and TRS2 parameters are the temperature coefficients for the series resistance in the diode model. The TRS1 is the linear coefficient,
and the TRS2 is the quadratic coefficient. These two parameters operate in the same manner as the temperature coefficients for the resistor
component.
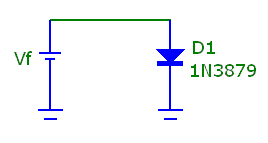
The circuit below is used to plot the forward current versus forward voltage curve. The diode model is the 1N3879 fast recovery power
rectifier whose data was derived from the Motorola "Rectifiers and Zener Diodes" data book. The only other component in the schematic
is a battery with the part name Vf that will be used to sweep the forward voltage across the diode.
|

|
To simulate the forward current versus forward voltage curve, the circuit is run in DC analysis. In the DC analysis
limits, the Vf battery is swept linearly from .8V to 3.2V in increments of .01V. The Temperature field is set to run
two branches of the simulation. One branch will be run at 150C. This will be the branch used to optimize the XTI,
TRS1, and TRS2 model parameters. The second branch is run at 27C just to show the nominal curve of the 1N3879 diode.
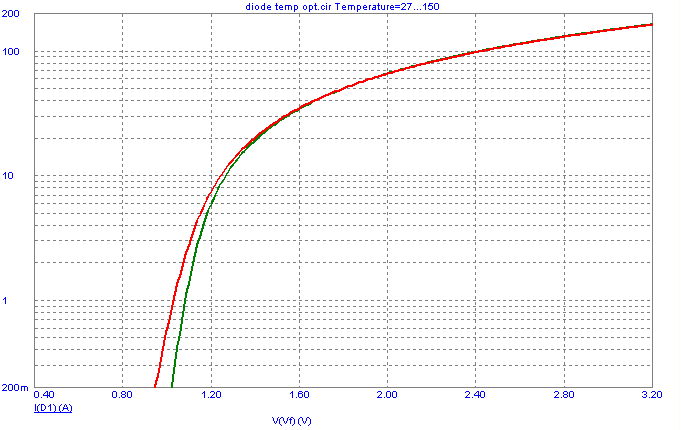
The resulting DC simulation is shown below. The green curve is the branch when the temperature is set to 27C and provides
an excellent match to the equivalent curve shown in the Motorola data book. The red curve is the branch when the temperature
is set to 150C. This curve is a good deal off from the one specified in the data book which shows that the default temperature
parameters in the model are not a good match for this device.
|

|
The circuit optimizer can now be used to derive better values for the 1N3879 temperature model parameters. To
enter the optimizer, select the Optimize command in the DC menu. The dialog box shown below display the optimizer
settings for the XTI, TRS1, and TRS2 parameters.
|

|
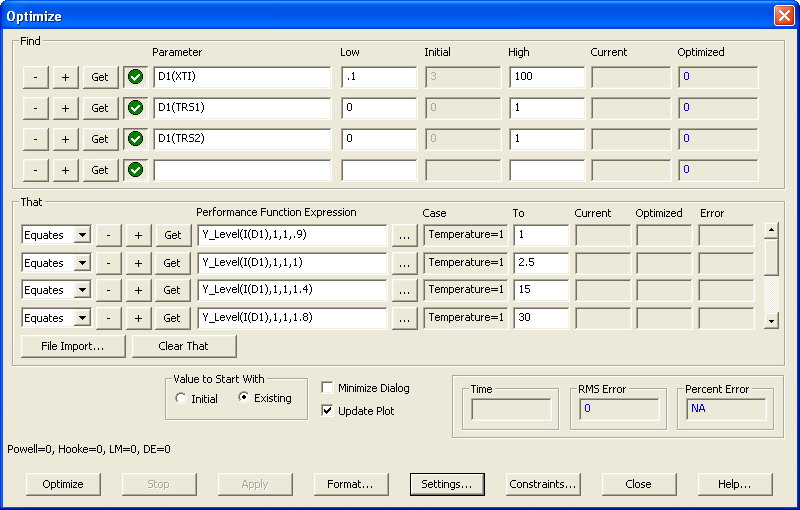
The Find section specifies the parameters that are to be optimized. All three parameters are setup to be optimized within the D1
component in the schematic. The parameter to be optimized can be selected by clicking on the Get button.
Since the object in this optimization is to match the forward current from the Motorola data book at 150C, the optimizing
criteria in the That section for each function is set to Equates. This is the criteria that needs to be used for any curve
fitting operation. A sampling of data from the data book for the curve at 150C is as follows:
@ Vf = .9, If = 1
@ Vf = 1, If = 2.5
@ Vf = 1.4, If = 15
@ Vf = 1.8, If = 30
@ Vf = 2.6, If = 58
@ Vf = 3.2, If = 81
The equivalent performance functions along with their To values that the optimizer needs to use to match to this data is:
Function: Y_Level(I(D1),1,1,.9) To: 1
Function: Y_Level(I(D1),1,1,1) To: 2.5
Function: Y_Level(I(D1),1,1,1.4) To: 15
Function: Y_Level(I(D1),1,1,1.8) To: 30
Function: Y_Level(I(D1),1,1,2.6) To: 58
Function: Y_Level(I(D1),1,1,3.2) To: 81
For each of these functions, the Case field has been set to Temperature=150 in order to optimize the correct branch of the simulation.
The Y_Level operator will try to optimize the Y value of the expression I(D1) at the specified X value to the value that is set
in the To field. Since the X Expression in the DC Analysis Limits dialog box is set to V(Vf), the X value is the forward voltage
across the diode. For example, with the first expression in the list, when the forward voltage is .9V, the optimizer will try to
determine the values of XTI, TRS1, and TRS2 so that the forward current of the diode is equal to 1. Since six performance functions
have been specified, the optimizer will find the values of XTI, TRS1, and TRS2 that produce the curve that creates the smallest total
RMS error between the target and actual values at each point. Each of the Equates conditions are weighted equally in terms of importance
when optimizing.
Clicking on the Optimize button initiates the optimization. The Powell optimization method finds the closest match to the specified
data points. The optimizer has calculated a value for XTI of 14.241, a value for TRS1 of 21.779p, and a value for TRS2 of 78.095u.
The values for these parameters produce a good match to the data book values having just a 3.7% error.
Clicking on the Apply button will update the diode model in the schematic so that the new XTI, TRS1, and TRS2 values are used. Applying
the updated parameters from the optimizer does not actually overwrite the 1N3879 model in the Micro-Cap library file, but it localizes
the model in the Models page of the schematic so that the changes only affect this specific circuit. The model statement could then be
copied into the Micro-Cap library or copied into any other circuit file that would use the model. The updated model for the 1N3879
appears as follows:
.MODEL 1N3879 D (BV=50 CJO=107.82034563878P IBV=100.000001335143P
+ IS=4.641638012946F M=313.660097529485M N=1.255501899871 RL=6.04477627237MEG
+ RS=12.028656788586M TRS1=21.779p TRS2=78.095u TT=369.945519216272N
+ VJ=1.269832856815 XTI=14.241)
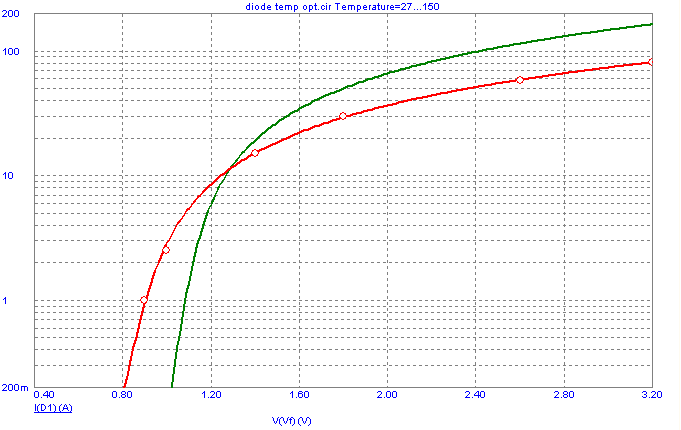
This model is a copy of the 1N3879 model from the Micro-Cap library with just different values for XTI, TRS1, and TRS2. Running the
same schematic with the updated model statement produces the forward current versus forward voltage curves shown below. The green
curve for the 27C branch has not changed at all. However, the red curve for the 150C now closely matches its equivalent curve from the Motorola data book.
|

|
|
|
|
|


