|
|
 |
Introducing Micro-Cap 10
We are pleased to release the next generation of the Micro-Cap simulator, Micro-Cap 10. A number
of new features, analyses, and models have been added to enhance the simulation power and the
ease of use of the interface. A preview of some of the new features follows. Please contact our sales
department for upgrade or pricing questions.
Analysis
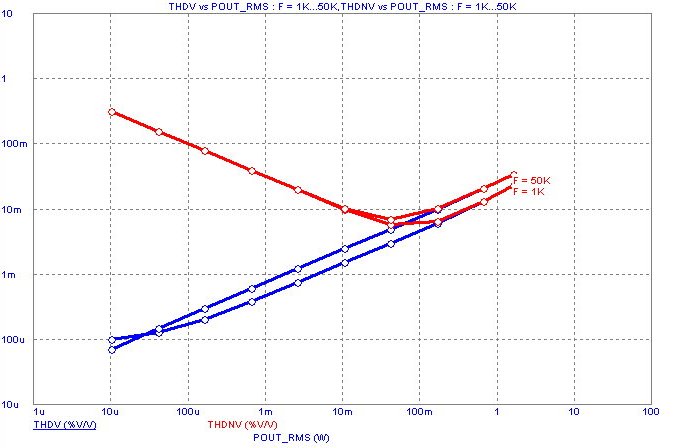
Harmonic Distortion Analysis
Harmonic Distortion analysis is a type of transient analysis in which a single frequency sinusoidal
signal is applied to an input source and the resulting distortion measured in the output. If a signal
at a particular frequency is applied to the circuit input and if the circuit is not linear, signal level will
be found at some frequencies other than the input frequency. In other words, distortion will occur.
Harmonic Distortion analysis measures this distortion and provides plots of THD, THDN, SINAD,
SNR, and Hm (m'th harmonic) vs F, and the peak and RMS versions of VIN, VOUT, PIN(Input
Power), and POUT(Output Power). The analysis makes extensive use of Periodic Steady State techniques
to improve accuracy and speed.
|
|
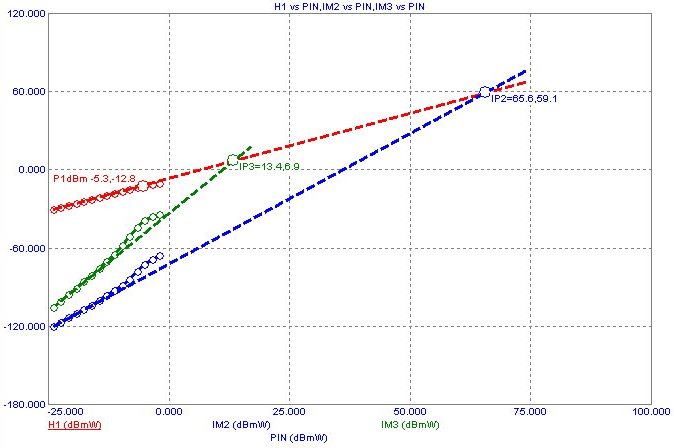
Intermodulation Distortion Analysis
Intermodulation analysis is a type of transient analysis in which two sinusoidal signals are applied to
an input source and the resulting intermodulation products at the sum and difference frequencies
are computed. Plots of H1, IM2, and IM3 vs F, and both peak and RMS versions of VIN, VOUT,
PIN(Input Power), and POUT(Output Power) are available.
The program will optionally find and mark the 1dBm compression point (P1dBm) and the second
and third order intercepts (IP2 and IP3). The analysis also makes extensive use of Periodic Steady
State techniques to improve accuracy and speed.
|
|
Periodic Steady State (PSS)
Periodic Steady State uses techniques pioneered by Aprille and Trick to calculate the periodic steady
state, removing any short term transients from the time-domain waveforms, greatly simplifying
many types of circuit analysis problems. This new analysis mode was added to Transient, Harmonic
Distortion, and Intermodulation Distortion. It is executed after the optional operating point and
runs in lieu of the normal time domain run. PSS uses a shooting method to eliminate transients
normally encountered to arrive at steady state waveforms.
Threading
Micro-Cap 10 uses threading for significant speed improvement where multiple CPU cores are available.
When multiple independent analyses are requested, Micro-Cap uses threading technology to
speed up the overall analyses by allocating each sub-analysis to a different CPU core. This is beneficial
when stepping temperature or parameters, in Monte Carlo Analysis, and with harmonic and
intermodulation distortion analysis.
New Optimization Algorithms
Optimization has been improved by the addition of three new methods. These include Hooke,
Levenberg-Marquardt, and Differential Evolution. Each method has its own strength and is optimal
in different kinds of problems. Together they provide powerful assistance in solving optimization
problems. The new methods are available in each analysis optimization routine and in the Model
program optimizer.
Optimizer Curve Fit From File
The optimizer has been expanded to allow importing data sets from a file to facilitate using the optimizer
to curve fit with large data sets.
Cursor Values in Text Expression
This lets you write analysis expression text using cursor values CursorLX, CursorLY, CursorRX,
CursorRY as variables.
AC Power
AC power is now calculated as P = V * Conjugate(I).
Time-domain Power
When RMS on-schematic display is requested, transient analysis power is now calculated as P =
RMS(V) * RMS(I).
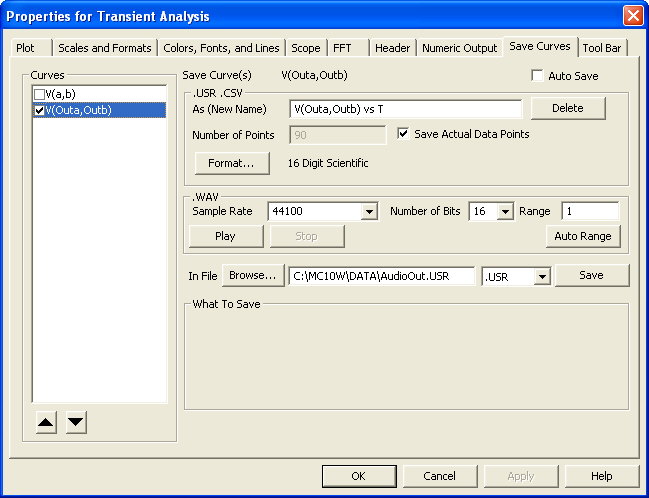
Import and Export of WAV files
WAV audio files can now be imported and exported allowing one to "hear" the output of an audio
amplifier.
|
|
Save Curves Auto Save
This option automatically exports selected waveforms to a file after each run.
Branch values in plots
This lets you plot expressions that use waveform values from different branches. A branch is a
Monte-Carlo case or a stepped value. V(1)@1 - V(1)@2 plots the difference of V(1) between branch
1 and branch 2.
Point Tag Numeric Format
The X and Y numeric formats of point tags are now separately specifiable.
HSPICE Compatibility
A small step toward compatibility with HSPICE files was taken by allowing '3*V(1)' to mean the
same thing as {3*V(1)}.
Plot, Save but Don't Plot, Don't Save and Don't Plot
These button options can be selected for each waveform or curve in the Analysis Limits dialog box.
Enable / Disable / Hide
By right-clicking in the Page or P (Plot) fields you can enable, hide, or disable all curves that use the
Page or Plot number. Enable saves the data. Disable does not. Hide stops the plot display but saves
the data.
Sort Function for Page and Plot Number
The page names and plot numbers can now be sorted alpha-numerically.
Distortion Plots Waveform Buffer
Distortion plots created in harmonic and intermodulation analyses can be saved and recalled from
the Waveform Buffer.
FFT Dialog Box
The FFT panel on the Analysis Properties page (F10) has a new field called Frequency Step. Enter a
value here and an adjustment is made in the Lower Time Limit value and vice versa, according to the
formula, Frequency Step = 1 / (Upper Time Limit - Lower Time Limit).
FFT Auto-scaling
FFT auto scaling is now done using the FFT upper and lower time limit parameters rather than the
older TMAX, TSTART.
Sweep Resistance in DC Analysis
Resistance values may now be directly swept in DC analysis.
Copy Cursor Values to Clipboard
This lets you copy the contents of the cursor table to the clipboard.
Time Data Retention
The definition of the transient analysis Time Range format of tmax, [tmin] has been changed to
tmax, [tstart]. The analysis always starts at T = 0 but data points prior to tstart are now discarded
after plotting. If you move the plot or rescale it after the run is over the data points prior to tstart
are not replotted because they have not been saved.
Plot Expression Right-Click
Additional functions are now available by right clicking on the underlined expression text within the
plot, including scales and formats, and plot line and text color.
Histogram, Performance, 3D, FFT Windows
The old limit of 10 for these windows was eliminated.
Stepping Enabled
When stepping is enabled, the Stepping button in the Analysis Limits dialog box is shown in bold.
Initial Conditions Editor Format
A Format button provides numeric format control for the .IC, Write, and Print commands.
AC Analysis Limits Default Changes
The Frequency Range method now defaults to Log, and the Number of Points now defaults to
1001.
Noise Output Nodes Prompt
Right-clicking in the Noise Output field of the AC Analysis Limits dialog box provides a list of
available node names.
Improved Illegal Expression Error Messages
The error message for illegal expressions was expanded to show the entire expression and the point
in the expression where the error occurred.
Error Page
A separate error page now captures all errors generated by an analysis. This is useful when errors
that do not stop the run are encountered. This page keeps a record of them for later perusal. For
example, a Monte Carlo run of 1000 cases may generate a few "Timestep too small" errors but the
overall 1000 run sequence continues and deposits error messages here.
Function Source Extension
Function voltage and current sources can now reference the B, H, and Flux values in their expressions.
Sensitivity Analysis
The output expression limit of 10 has been removed.
Schematic Editor
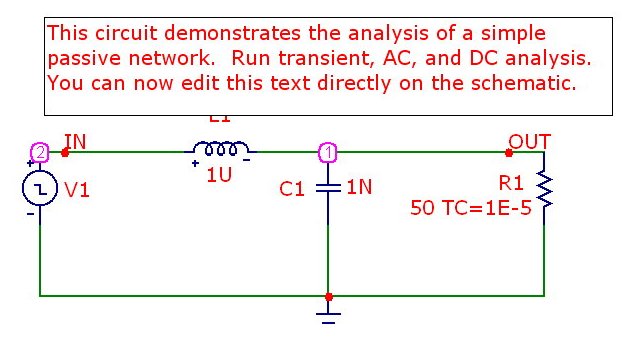
On-schematic text editing
Grid text can be edited directly by double clicking the text body while holding down the Alt key.
|
|
Favorites
A Favorites tab was added to the Component Panel. This tab keeps track of your component usage
and provides a list arranged with the most often used parts at the top.
Mouse Info Box
When you hold the mouse over a part, this box shows basic information like voltages and currents.
The content of the box now optionally contains much more data such as beta, capacitance, conductance,
and many more values from the internal device structure.
Text Search
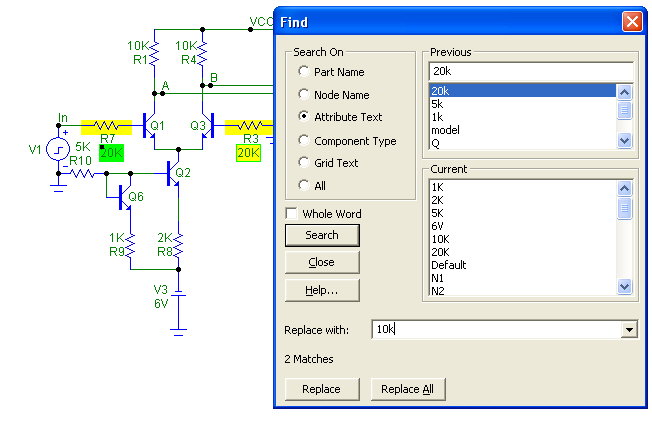
The text find command was elaborated to show all instances of the text, as it is being typed. The
currently selected piece is highlighted with Previous and Next navigating the instances found.
|
|
Find Command
This command now allows Find and Replace operations on any attribute or grid text.
Local VIP Font and Format Control
The font and numeric format of node voltages, pin currents, and power values are now controlled
from the circuit Properties page (F10), rather than being global formats that apply to all circuits.
Color/Font Change
The new Change / Attribute feature has been expanded to allow simultaneous changes of color and
or font of selected part attribute text.
Global Settings Default
Non-default global settings are now shown with bold printing to emphasize the change.
Text Align
This command lets you align selected grid or attribute text.
User Created Toolbar Bitmaps
Users can now create and assign new bitmaps for favorite commands.
Schematic region enable / disable
A Show/Hide capability for the boolean enable text was added as well as font/color control. On schematic
text editing was added for the enable text.
Find Component
The size of this dialog box is now adjustable to provide more space for large lists of parts that
match the specified text string.
Close All Files
A command was added to close all open files.
File Save
This command now allows saving a circuit file while in an analysis.
Topology Check Option
The Path to Ground, Voltage Loop, and Floating Nodes checks are now optional.
Windows Dialog Box
A Windows dialog box was added to easily activate, close, or save open windows.
Bill of Materials Parts Grouping
The Parts can be grouped (as in earlier versions) or ungrouped according to the status of the Group
Parts check box.
Automatic Check for Update
The program now automatically checks the web site to see if a newer version is available.
Model Program
User-defined circuits optimizing
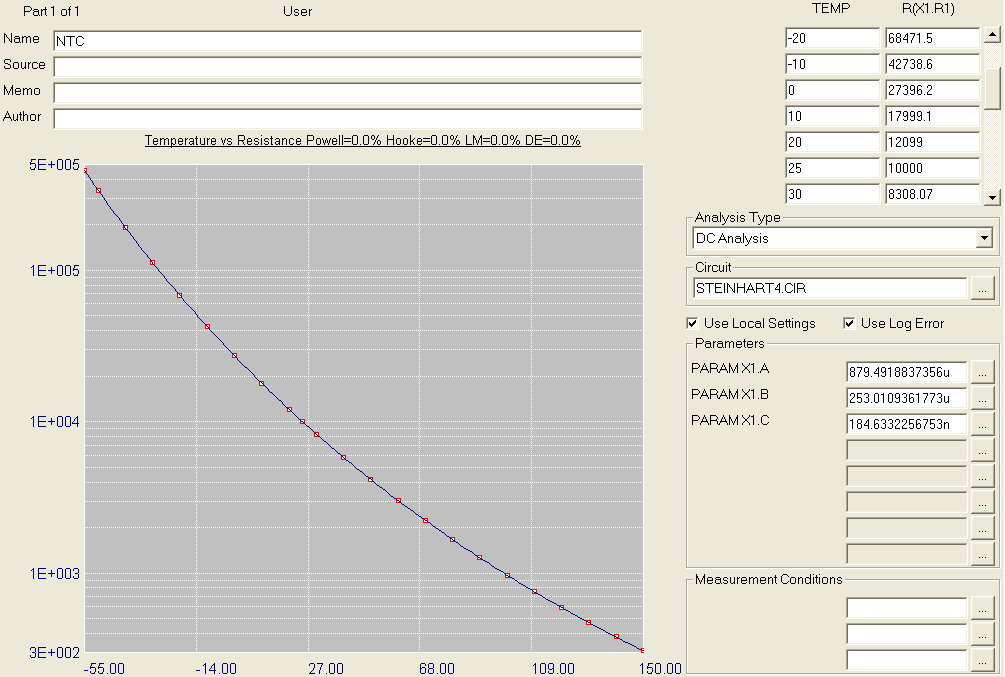
Model now supports optimization using user defined test circuits. No longer are you limited to determining
parameters for a fixed number of devices. Test circuits can be created to determine optimized
parameters for BSIM3, BSIM4, PSP, IGBT, and other devices. Subcircuits, macros, or model
statements can be created from the optimized data. In the figure below, the Steinhart and Hart parameters
for an NTC subcircuit model are optimized.
|
|
More Optimizers
Model optimization has been improved by the addition of three new methods. The complete list of
methods now includes:
Powell
Hooke
Levenberg-Marquardt
Differential Evolution
BJT Parameters
BJT optimized parameters now include the NK parameter.
Models
WAV File Source
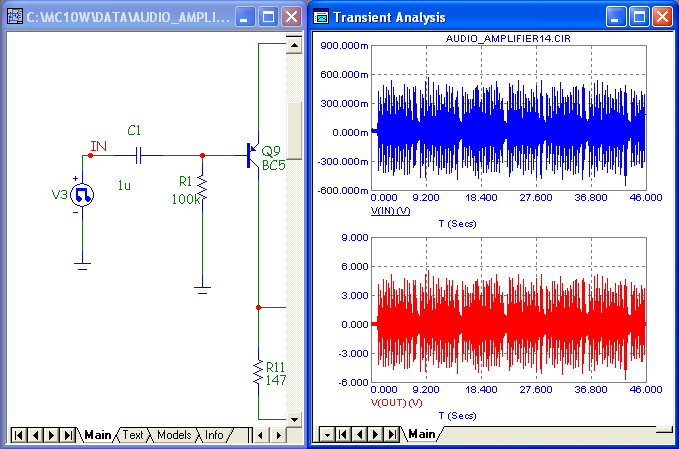
This source gets its waveform from a specified .WAV file, allowing convenient importation of audio
and other waveforms.
|
|
IBIS models
The IBIS model was expanded to handle the I/O open drain, I/O open source, I/O open sink,
open drain, open source, and open sink models.
BJT Quasi-saturation model
The BJT model was expanded to handle the quasimod, rco, gamma, and vo parameters.
Monte Carlo
GAUSS and UNIF functions
The GAUSS, AGUASS, UNIF, and AUNIF functions can now be used to compactly specify a
component's distribution values.
Eliminate Outliers
For Gaussian distributions, an option is now available to eliminate any values outside of the tolerance
band.
User Defined Scales
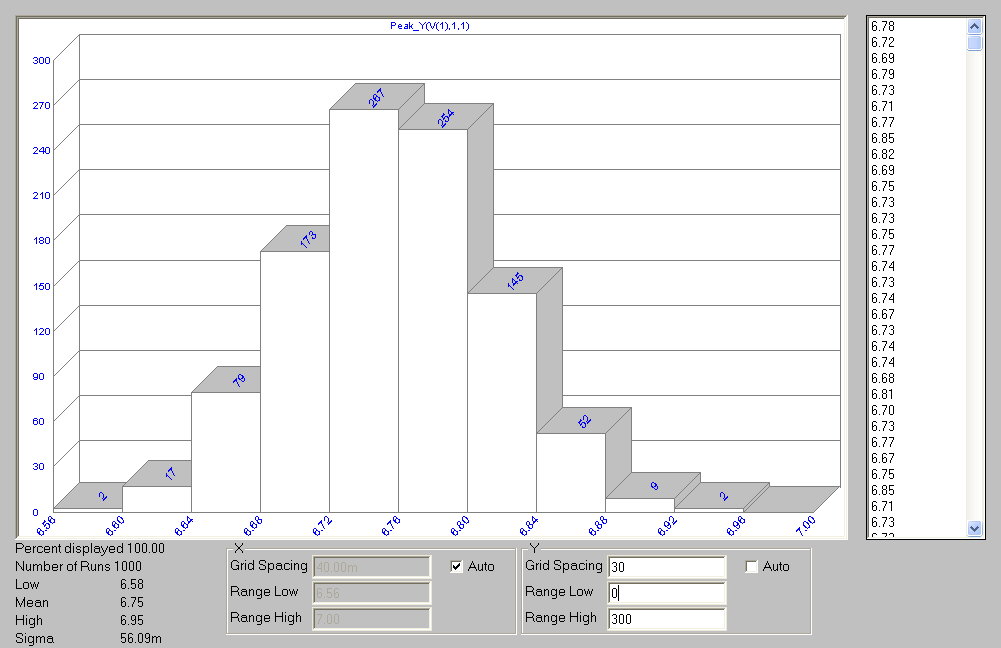
Histogram X and Y scales can now be set by the user.
Bar Tops
Histogram bar tops can be annotated with either quantity found or percentage found in each bar's
range.
|
|
Runs Display
The histogram display includes the number of runs.
Low, Mean, High Format
These quantities are now shown in engineering notation, e.g. 10n vs 1e-8.
Statistics in Printout
The low, mean, high, and sigma (standard deviation) are now shown in the numeric output.
Expressions
Int Operator
The INT operator was added. INT(2.7) = 2.
Nint Operator
The NINT operator was added. NINT(2.7) = 3.
HarmN Function
The HARMN function was added. Its output is the same as the HARM function, but normalized to
the 1st harmonic's value.
Plotting D(NODE) and V(NODE)
When you have a digital node connected to an analog node, D(NODE) plots the waveform for the
digital node and V(NODE) plots the analog waveform.
Component Editor
Improved Add Part and Import Wizards
These routines has been enhanced to show how the part will look when a template is selected.
Save and Revert Options
The Save and Revert options are now available on the tool bar, so it is no longer necessary to quit in
order to save or restore the file you are working on.
Shape Editor
Find Command
A Find command facilitates locating shape names.
Picture Files
Picture files may be imported to serve as a part of a shape file.
Duplicate Command
A new Duplicate command makes an exact copy of the selected shape and assigns it a new name.
Groups
Shapes may now be assigned group names.
Save and Revert Options
The Save and Revert options are now available on the tool bar, so it is no longer necessary to quit in
order to save or restore the file you are working on.
Package Editor
Auto Check
Entering a new package automatically enables it by setting its check mark.
Multiple Entries
Multiple packages can now be entered by assigning a duplicated entry to more than one package at a
time.
|
|
|
|
|


