|
|
 |
Memristor Macros
The memristor device is the fourth elementary passive element (in addition to the resistor, capacitor, and inductor)
that was first theorized about by Prof. Leon Chua in 1971 and finally developed recently by HP Labs. The resistance
of the memristor will change depending on the flow of charge for the device. If the charge flows in one direction,
the resistance of the device increases. If the charge flows in the other direction, the resistance of the device
decreases. The key to the memristor is that when the flow of charge stops, the device remembers the last resistance
it was at, so that when the flow of charge resumes, the device also resumes operation at the previous resistance.
The memristor has great potential for low power, high density memory applications.
Prof. Dalibor Biolek, who helped develop a SPICE model for the memristor (Reference 1), has generously supplied Spectrum
Software with a couple of memristor macros along with four test circuits which are in Micro-Cap 9 format. The files are
available in the Summer 2009 section of our Newsletter page on the website.
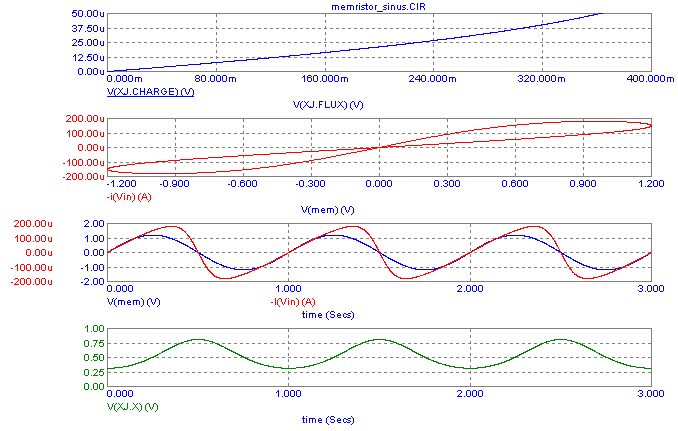
The first memristor macro (Memristor_J.Mac) uses the Joglekar window function which is the conventional model for simulating
the nonlinear dopant drift of a memristor. Driving this memristor macro with a 1.2V, 1Hz sinusoidal voltage produces the
transient simulation shown below.
|

|
The top plot shows the relation between the charge and the flux of the memristor which demonstrates the one-to-one
correspondence between the two as expected in memristor theory. The second plot shows the hysteresis loops within
the I-V curves of the memristor. Increasing the frequency of the driving sinusoidal voltage will gradually suppress
the hysteresis curves. The third plot displays the voltage and current waveforms of the memristor in the time domain.
The bottom plot shows the ratio of the actual width of the doped area to the width of the entire memristor thin film.
In this simulation, the ratio does not approach the boundary limits where the dominant nonlinear effects occur.
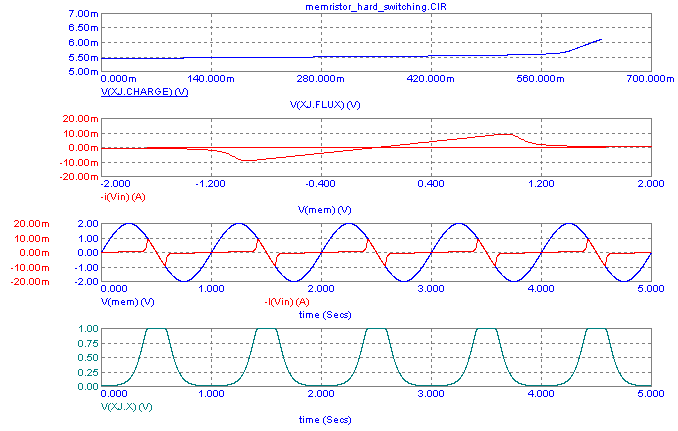
Lowering the Roff/Ron ratio of the memristor and increasing the sinusoidal voltage to 2V produces a simulation that displays
the hard switching case. The transient simulation for this configuration is shown below. This simulation was run a few
times with the State Variables option set to Leave in order to reach the steady state operation.
|

|
The same plots from the previous simulation are plotted again. As can be seen in the bottom plot, the hard switching
occurs when the ratio of the width of the doped region to the width of the memristor is switched between the low and
high boundary limits. The corresponding nonlinear effects of the hard switching can be seen in the current plots of
the memristor.
The second memristor macro (Memristor_B.Mac) uses the Biolek window function for simulating the nonlinear dopant drift.
The Joglekar window function used in the first macro file models the ideal memristor properties. However, this window
function can have problems when the memristor is operated under some hard switching conditions. When the memristor is
driven to its Ron or Roff values, the Joglekar window function can lock in on that state with no means to drive it back
to normal operation. The Biolek window function includes some nonideal factors and suppresses the memory effect on the
boundary states to more accurately model the probable real life operation of the device.
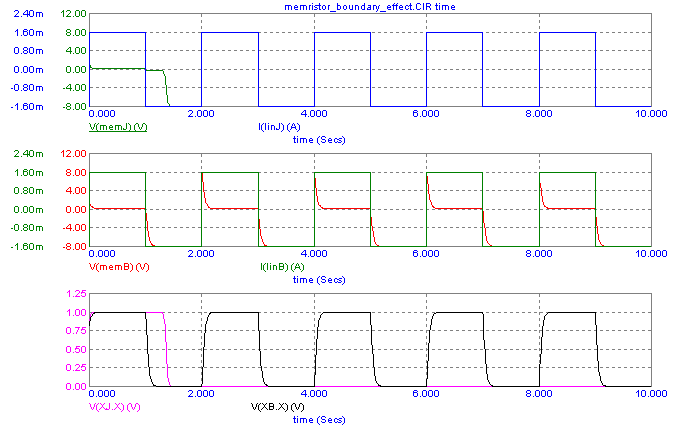
In order to compare the boundary effects of the two window functions, each type of memristor is driven by an identical
1.6mA current pulse source. The transient analysis results of this simulation is displayed below.
|

|
The waveforms in the top plot show the voltage and current waveforms for the memristor macro that uses the Joglekar window
function. Once the driving current becomes large enough to switch the memristor into one of its boundary states, the
memristor locks into that state and no external stimulus can change the memristor back to another resistance value.
The waveforms in the middle plot show the voltage and current waveforms for the memristor macro that uses the Biolek window
function. Even though the memristor is being driven with the same current, it is not being locked into either boundary
state which is the expected operation of an actual memristor.
The waveforms in the bottom plot shows the ratio of the actual width of the doped area to the width of the entire memristor
thin film for both memristor macros. The V(XJ.X) waveform plots the ratio for the memristor using the Joglekar window
function, and the V(XB.X) waveform plots the ratio for the memristor using the Biolek window function. For the Joglekar
plot, the waveform locks into the 0 state after the first current pulse and no longer reacts to any of the following
current pulses.
The Memristor_J macro provides a macro that will simulate according to the ideal memristor theory whereas the Memristor_B
macro tries to incorporate a little more of the real world effects that a memristor may have.
Reference:
[1] BIOLEK, Z., BIOLEK, D., BIOLKOVA, V. "SPICE model of memristor with nonlinear dopant drift." Radioengineering, 2009, vol. 18, no. 1.
http://www.radioeng.cz/fulltexts/2009/09_02_210_214.pdf
|
|
|
|
|


