|
|
 |
Plotting an AC Coupled Waveform
AC coupling of a waveform displays only the AC signal while blocking the DC portion of the
waveform. In practice this is done by placing a capacitor between the measuring point and
the probe. This is useful when trying to view a characteristic of the waveform such as its
ripple. If the ripple is small compared to the DC value of the waveform, the ripple can be
difficult to view when the plot is scaled with regards to the DC value.
In Micro-Cap, there are a few ways to offset the DC portion of the waveform in a plot. If
the DC value is known, an expression such as:
V(Out) - 10
can be plotted where 10 is the DC portion of the V(Out) waveform. This cancels out the DC
contribution to the waveform. However, in most cases, the DC value will not be known or may
change from run to run.
Another method is to place a high pass filter on the node of interest and then plot the
waveform at the output of the filter. The negatives of this method are that settling time
issues and the loss of low frequencies can have a significant effect on the filtered waveform
so the filter values must be chosen carefully.
The method for plotting an AC coupled waveform that will be examined in this article is to
use the partial Fourier series function, FS. The FS function has the following syntax:
FS(u,[[n1],n2])
u is the waveform that is to be reconstituted from the specified range of Fourier terms. n1
and n2 are optional parameters and define the range of Fourier terms to be used in the calculation.
n1 defaults to 0, and n2 defaults to the FFT Properties value of Number of Points/2. The output
is the compiled sum of the Fourier terms from n1 through n2. For example, if the following
expression is used:
FS(V(Out),1,10)
The Fourier series of V(Out) will first be calculated. Then the Fourier terms from the first
harmonic to the tenth harmonic will be summed. The resulting sum will be the V(Out) waveform
reconstituted with just the contributions from the first ten harmonics. For AC coupling, the FS
operator would be specified as:
FS(V(Out),1)
In this case, the V(Out) waveform would be reconstituted using the contributions from the first
harmonic to the last calculated harmonic (since n2 is unspecified), omitting only the 0'th or DC
harmonic.
The FS function is an FFT function so it uses the time range and the number of points specified
in the FFT page of the Analysis Properties dialog box. To get valid results from this method,
the time range specified in the FFT page for the FS function to operate on should be when the
circuit is running in its steady state operation. Any initial transient in the analysis needs
to be excluded as that would skew the Fourier calculations used in the function.
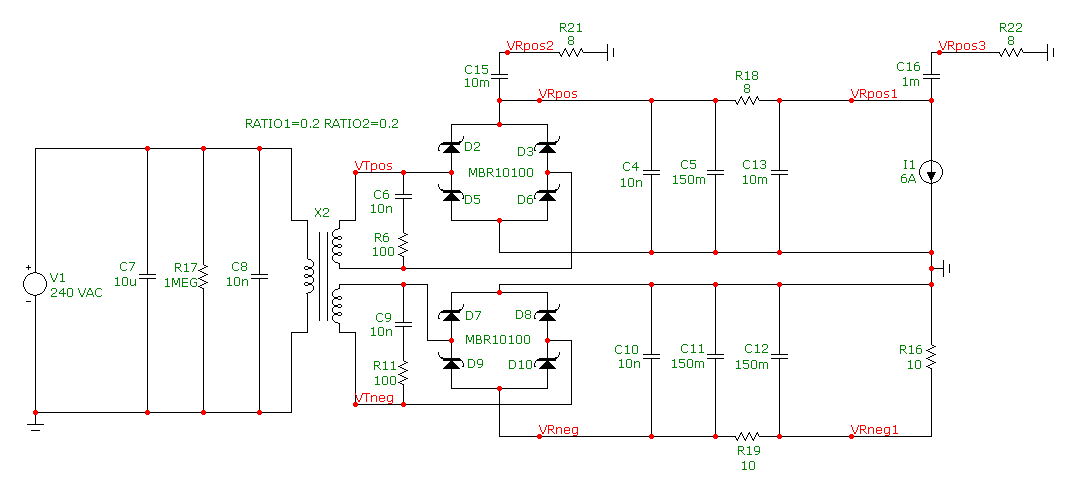
To show how the FS operator works as an AC coupler, the example circuit below will be simulated.
The circuit is a mains AC to DC rectifier. The V1 source represents the mains voltage and
produces a 320V peak, 50Hz sine wave input. This sine wave is fed into a multiwinding transformer.
The two output windings of the transformer are each connected to full wave bridge rectifiers to
create both a positive and negative DC voltage. PI filters are used with each bridge rectifier
to both decrease the ripple and reduce the harmonics of the output waveform. The AC waveforms of
interest are the ripples at the output of the rectifiers and the PI filters. A pair of high pass
filters have been added in the circuit at nodes VRpos and VRpos1 to provide a benchmark to the
accuracy of the partial Fourier series method.
|

|
The AC to DC rectifier will be simulated in transient analysis. The AC coupled waveforms at the
bridge rectifier and the PI filter of the positive voltage rail will be plotted. The partial
Fourier series expressions used to plot these two waveforms are:
FS(V(VRpos),1)
FS(V(VRpos1),1)
Both of these expressions reconstitute their associated waveforms with just the DC harmonic being
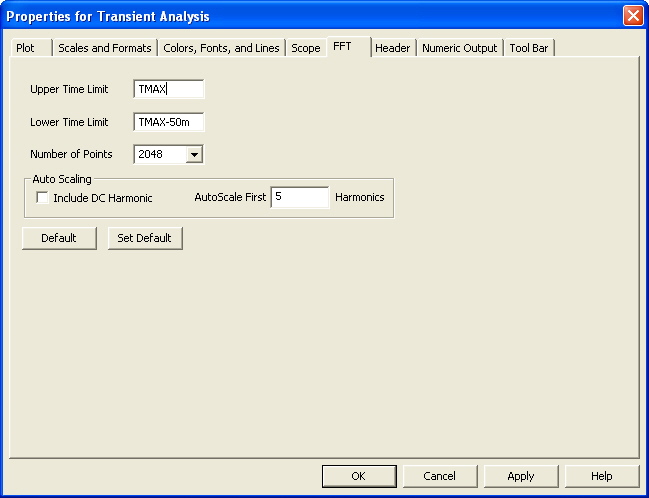
omitted. The transient simulation will be run over a time range of 2 seconds. Since the FS function
is an FFT function, the values in the FFT page of the Analysis Properties dialog box have been set as
shown below. The Upper Time Limit is set with the TMAX variable which uses the ending transient
analysis time which in this example is 2s. The Lower Time Limit is set with the expression TMAX-50m
which evaluates in this simulation to 1.95s. With these settings, the last 50ms of the simulation
will be the time range that any FFT function operates on. The Number of Points field is set to 2048.
This value determines the number of Fourier terms that will be calculated in the first part of the FS
operation. For the FS function, the Number of Points should not be too great as the calculation time
can be long for larger values. The Auto Scaling section is not relevant to the FS function.
|

|
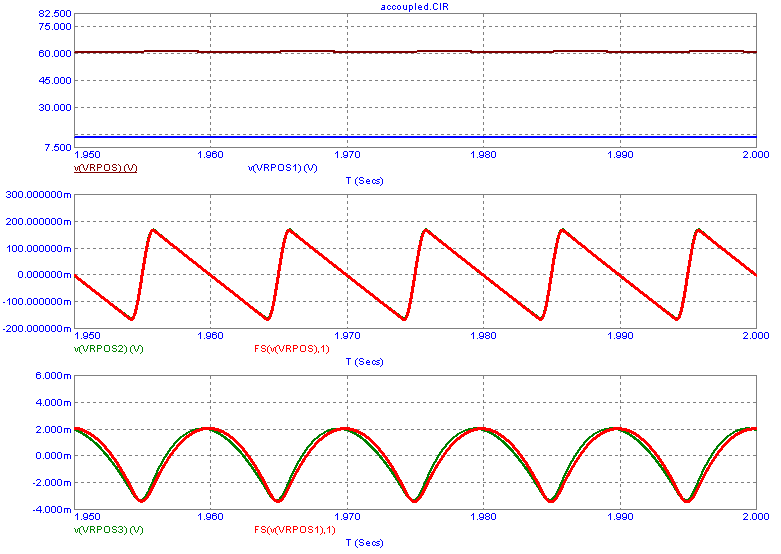
The resulting transient analysis is shown below. Only the last 50ms is displayed in the plot. With
the specified FFT page settings, this is the only data available for the simulation. This time
window eliminates the initial transient in the circuit simulation that would have skewed the desired
results for the AC coupling.
The FS function is a post processing function which means that it does not calculate and display
its results until the simulation has finished. The expression will just plot a line at zero until
the simulation finishes, and the function is able to produce the specified waveform.
The top plot shows the voltage at the positive rail rectifier and filter outputs. The disparity between
the two DC levels along with the relatively small size of the AC portion on these waveforms make it
extremely difficult to gauge the ripple characteristics. One would need to zoom in manually on one of
the waveforms to see anything of interest.
The middle plot shows the ripple at the positive rail rectifier. The ripple has a triangular shape
with a magnitude of approximately 165mV. The V(VRpos2) expression plots the comparable AC coupled
voltage at the output of the C15-R21 high pass filter.
The bottom plot shows the ripple at the positive rail PI filter. Due to the effect of the PI filter the
ripple magnitude has been greatly descreased to just a few millivolts. Note that the ripple now has much
more of a sine wave shape which reduces the harmonics present in the waveform compared to the triangular
shape of the prefilter ripple. The V(VRpos3) expression plots the comparable AC coupled voltage at the
output of the C16-R22 high pass filter.
|

|
|
|
|
|


