|
|
 |
Modeling Photodiodes
Photo diodes convert light energy to electrical energy. They are used in a variety of
applications, including optoelectronic communications, isolation, and motion detection
and control. They are particularly valuable where it is necessary to isolate the
incoming signal from the circuitry that uses it.
A photo diode is constructed in the usual way, by doping semiconductor material to form a
pn junction. The semiconductor materials commonly used are silicon, indium, aluminum,
gallium, and arsenic. Depending upon the process and materials used, photodetectors can
be optimized for any part of the spectrum from ultraviolet to infrared. The diode is
packaged in such a way as to focus the incoming light through a lens, and occasionally
through an optical filter, directly on the diode junction. The photons in the incident
light break covalent bonds in the depletion region, producing electron-hole pairs that
are swept across the junction by the electric field imposed by the external circuitry.
The resulting current is proportional to the intensity of the incoming light. The
result is an amplifier with an almost infinite impedance separating the input from
the output. There is no Miller capacitance to degrade performance or cause cross-channel
interference.
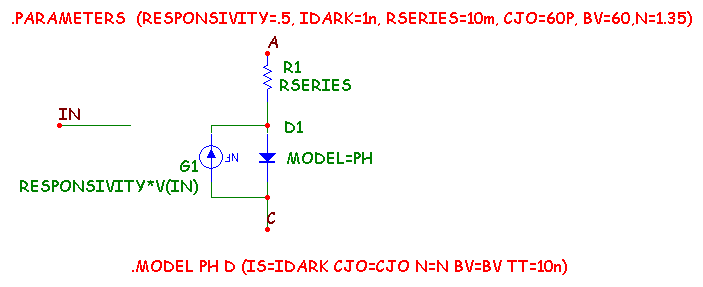
How do we model a photo diode? It is pretty simple and looks like this:
|

|
The model consists of a diode paralleled by a voltage-controlled current source, G1. The
source creates the light current in the junction under control of the voltage at the IN
pin. The voltage on this pin is an analog for the optical power in watts incident on the
detector. The model uses six parameters:
RESPONSIVITY - This is the sensitivity expressed in units of amps per watt. Sometimes it
is expressed as current for a given input power density, usually mW/cm^2. The exact units
do not matter so long as the control voltage pin produces the expected current, through
the relationship
I = RESPONSIVITY*V(IN).
IDARK - This is the current that flows across the junction when the diode is reverse
biased and there is no illumination. In this model, the diode IS value parameter is set
equal to the IDARK value.
RSERIES - This is the value of a resistor in series with the diode junction.
CJO - This is the junction capacitance of the photo diode. This primarily affects the
switching time of the diode.
BV - This is the junction breakdown voltage. This determines the largest usable
operating voltage for the diode.
N - This is the emission coefficient. It mainly affects the slope of the dark
current vs. temperature curve. The default value produces a doubling of dark current
for every 8 degrees C of temperature rise.
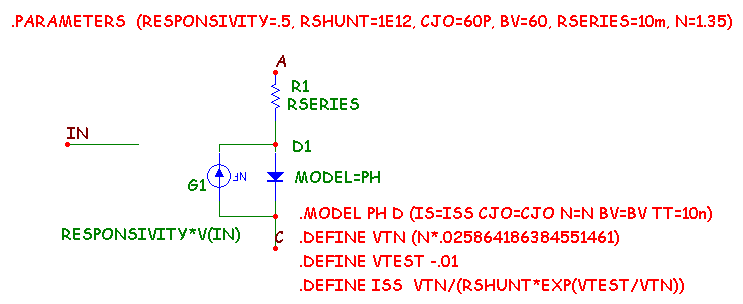
Here is an alternative model. It uses the same parameters as the first model except that
the RSHUNT resistance is used instead of IDARK to calculate the diode IS parameter. The
RSHUNT resistance is the incremental resistance of the diode measured near zero bias.
|

|
Some manufacturers provide both RSHUNT and IDARK values. If the photo diode is to be
operated in photoconductive mode, where the diode is reverse biased, then use
the first model since accuracy of the IDARK value is more important.
If the photo diode is to be operated in photovoltaic mode, where the diode operates near
zero bias, then use the second model since accuracy of the RSHUNT value is more
important.
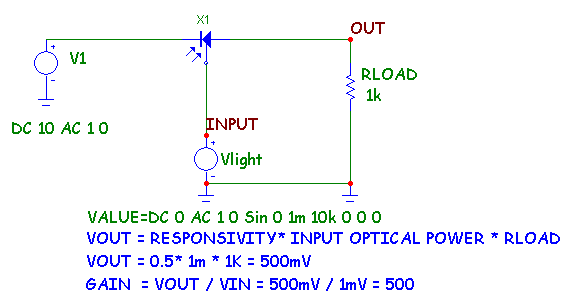
Here is a typical circuit operating in photoconductive mode. It shows how the photo
diode can be used to amplify and isolate the input from the output.
|

|
The photo diode is reverse biased by the V1 source. The incoming light is represented by
the source Vlight. Note that the wire connecting Vlight to the control pin represents a
communications channel that is usually just air.
The transient analysis of the circuit showing the 1mW input optical power waveform and
the output voltage waveform across the load RLOAD is displayed in the first plot below.
The AC analysis of the circuit showing the small signal magnitude and phase angle of the
output voltage, again across the load RLOAD is displayed in the second plot below. Both analyses
show the output small signal voltage to be:
VOUT = RESPONSIVITY* INPUT OPTICAL POWER * RLOAD
VOUT = 0.5 * 1m * 1K = 500mV
GAIN = VOUT / VIN = 500 / 1 = 500
|
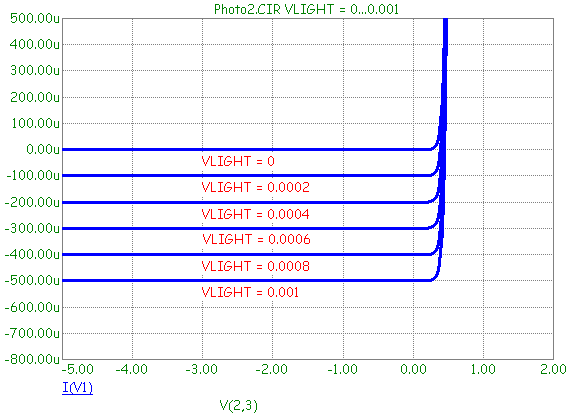
Here is the DC analysis of the circuit IV characteristics of the photo diode. This is
a plot of the diode current as measured through the source V1. Each curve corresponds
to a specific value of incident optical power ranging from 0 to 1mW.
|

|
Here are some guidelines for obtaining the photo diode parameters from manufacturer
specifications for the two models:
RESPONSIVITY - This parameter is usually specified but if not it can be estimated at
about 0.5 to 0.6 for wavelengths of 900nm. For blue wavelengths use about 0.3. For
UV wavelengths use a value of about 0.2. If you are unsure, simply use a value of
1.0 and then adjust the input voltage value to produce the expected photo current.
IDARK - The dark current is nearly always specified and is usually in the range of tens
of pA for UV diodes to as much as several uA for low cost silicon types.
RSHUNT - This parameter is usually specified but if not it can be estimated at 1E7. It
is usually specified in the range of 1E6 to 1E9.
RSERIES - If this parameter is not given it can be estimated at 5m. It is usually in the
range of 1m to 20m.
CJO - CJO is usually given and ranges from 1E-11 to 1E-9. Use the value for 0V of
reverse bias if more than one capacitance value is given. Sometimes the rise time is
given instead. You can roughly estimate the CJO value from the formula
CJO = TRISE / RLOAD.
BV - The junction breakdown voltage is usually specified. If not use the default value.
N - The default 1.35 N value can be adjusted to match Idark vs. temperature curves.
|
|
|
|
|


