|
|
 |
Using FFT Windows
The FFT Windows feature provides a simple method that can be used in order to plot the
basic FFT functions. It helps to automate many of the choices required to produce a
Fourier harmonic content plot. These windows can display the harmonics (in magnitude
or in dB), the phase of the harmonics, and the real and imaginary components of the
harmonics. In previous versions of Micro-Cap, if one of these functions was to be
plotted, it had to be specified before the simulation was run. With the FFT Windows,
any waveform that has been plotted in the simulation can have its harmonic contents
derived after the simulation has finished. The FFT Windows are simple to use as can
be seen in the following example.
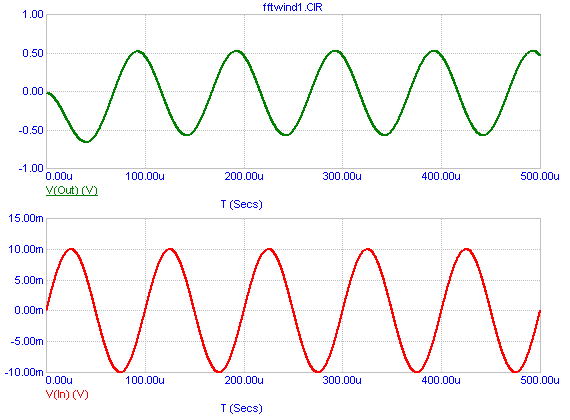
The analysis below is a 500us transient simulation of an operational amplifier modelled
at the transistor level. The input to the opamp is a 10mV, 10kHz sine wave. The opamp
has been configured to have a gain of 100 although at its 10kHz operating frequency, the
gain is reduced to 55. Both the input and output waveforms of the amplifier are being
plotted.
|

|
In order to invoke the FFT Windows, you can either right click on the name of the
waveform in the analysis plot and select Add FFT Window, or you can go to the
Transient menu, click on FFT Windows, and select Add FFT Window. When either one of
these actions is done, a Properties dialog box will be invoked that controls the display
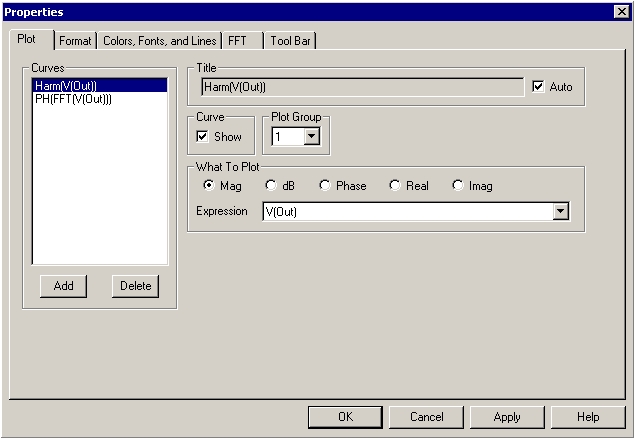
of an FFT Window. The Plot page of the FFT Window Properties dialog box is displayed
below. This page controls which waveforms will be plotted in the window. The default
waveform is the harmonics of the selected curve which is V(Out) in this instance. If
we also want to plot the phase of the harmonics in the same window, we would just need
to add another expression. Click on the Add button to add a new expression. Change
the What To Plot field so that Phase is selected. V(Out) will be the target expression
for this function also. Next, change the Plot Group for the phase expression to 2 so
it will be in a separate group from the harmonics expression. Click OK to create the
FFT Window.
|

|
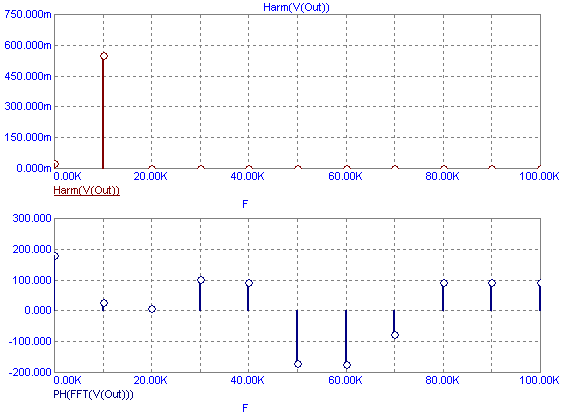
The resultant plot is displayed below. The plot displays both the harmonics and the
phase of the harmonics for the V(Out) waveform. The X scale for these plots has been
manually set in the Format page of the Properties dialog box to display from DC to
100kHz.
|
In the transient analysis plot, the output waveform doesn't settle down until the second
cycle, so there is an initial transient that will have an effect on the harmonic results.
This initial transient can be easily omitted from the harmonic results. Hitting F10 or
double clicking in the FFT Window will invoke the Properties dialog box for that window.
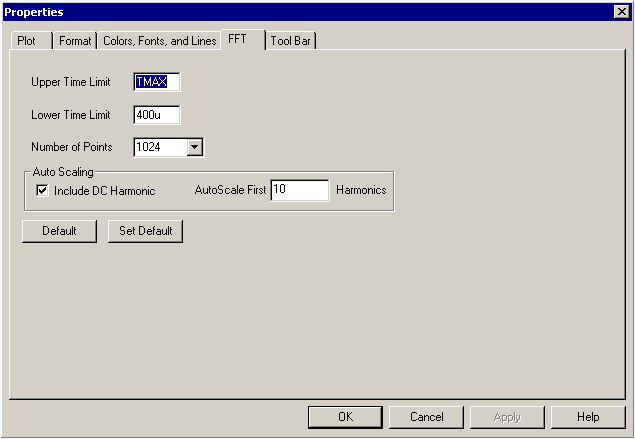
The time range that the harmonic functions operate in is defined in the FFT page of the
Properties dialog box as shown below.
|

|
The FFT page initially has its Upper Time Limit set to TMAX and its Lower Time Limit set
to TMIN. These variables take their values from the maximum and minimum times specified
in the Time Range field of the Transient Analysis Limits dialog box. As initially set,
the entire simulation will be included when deriving the harmonic results. To omit a
startup transient, change the time window that is being used. For our analysis, setting
the Lower Time Limit to 400u will create a 100us window in which one full cycle of the
output waveform is analyzed. The simulation information from 0s to 400us will be
ignored. The resultant display is shown below.
Note that the frequency interval that the simulation is being sampled with has changed
from 2kHz to 10kHz. The frequency interval is determined by the following equation:
1/(Upper Time Limit - Lower Time Limit)
|

|
A right click on the waveform name in the plot will also display any FFT Windows that
have already been associated with the specified waveform so that they can easily be
recalled. The FFT Windows submenu under the Transient menu will show all FFT Windows
associated with the analysis.
|
|
|
|
|


