|
|
 |
Diode Materials Temperature Parameter Values
When modeling a diode at the nominal temperature of 27C, the actual material of the diode
is irrelevant. As long as the diode parameters that have been defined for the model
can appropriately simulate the current and capacitance curves, the resulting model will
be applicable to the simulation. If the simulation is running at a temperature other
than 27C, then the EG and XTI diode temperature parameters must be defined with respect
to the semiconductor material of the diode being modeled.
The EG parameter defines the energy gap of the diode in electronvolts. This parameter
is completely dependent on the semiconductor material being used in creating the diode.
The XTI parameter defines the temperature exponent for the IS current. At 27C, neither
of these parameters will have an effect. At other temperatures, the EG and XTI parameters
should be defined according to the semiconductor material as shown below:
|
|
Material
|
EG
|
XTI
|
|
Silicon
|
1.11
|
3
|
|
Schottky
|
.69
|
2
|
|
Germanium
|
.67
|
3
|
|
GaAs
|
1.43
|
3
|
|
GaP
|
2.26
|
3
|
| |
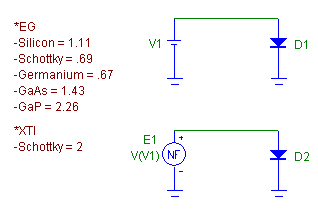
To demonstrate the effect that these two temperature parameters have on a diode, the
schematic below has been created in order to produce the basic If-Vf curve of the diode.
The top circuit consists of a battery that will drive the D1 diode that is in series with
it. The battery voltage in the schematic has been set to 5V, but that will be overwritten
when the DC sweep is performed. The bottom circuit has an NFV source that duplicates the
battery voltage in order to drive a second diode, D2. The only difference between the
two diode models is that the D2 diode has had its T_ABS parameter set to 27. This diode
will always run at 27C no matter what the temperature defined in the analysis limits is.
This will provide us a baseline If-Vf curve to compare to.
|

|
To produce the desired If-Vf curve, a DC analysis is run. In the DC Analysis Limits
dialog box, the V1 battery is swept from 0V to 1V in .001V increments. A linear step
method is chosen for this example. The temperature field has been set to 50C so that
the temperature parameters will influence the results. Both the EG and the XTI
parameters of the D1 diode are set up to be stepped. The EG parameter is stepped
through the list '1.11,.69,.67,1.43,2.26' and the XTI parameter is stepped through
the list '3,2,3,3,3'. These two parameters are stepped simultaneously so that there
will be five curves in the analysis with each curve simulating one of the materials
shown in the table above.
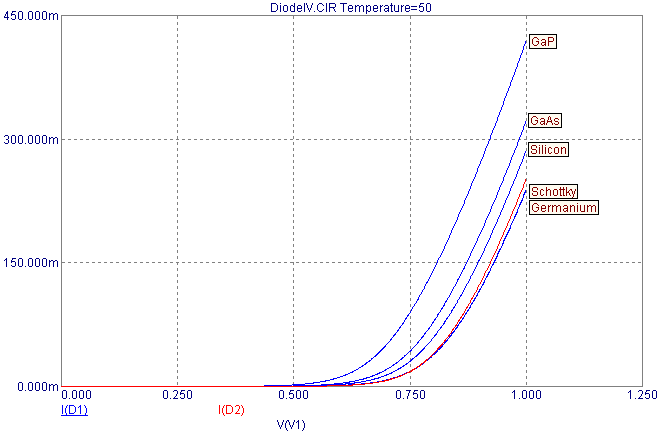
The resulting If-Vf curves are displayed below. The red waveform displays the If-Vf
curve of the diode when it is running at 27C. At this temperature, the semiconductor
material doesn't have an effect. The other five curves simulate the If-Vf curve at a
temperature of 50C for each of the semiconductor materials that are in the table. Each
curve is labelled with the semiconductor material that it represents. The germanium and
Schottky curves are nearly on top of each other since the EG parameters each uses are
nearly equivalent. As expected, the GaP semiconductor material shows the greatest
divergence from the nominal curve due to it having the largest energy gap. The default
temperature parameters for the diode model are set to model silicon.
|

|
|
|
|
|


