|
|
 |
The FFT Window
The FFT window is one way to plot frequency spectra. Of course, you can always plot FFT functions in
the main analysis plot window, but using the Fourier window makes the job a little easier. To illustrate,
we'll analyze the Ua709 circuit shown below.
This classic opamp was created in the late 1960s by Bob Widlar while at Fairchild Semiconductor. A classic
and enormously productive genius, Widlar invented many other analog building blocks that we now take for granted.
|
Note that we have used several .define statments to set the frequency and amplitude of the sine source
driving the circuit. Note also that the opamp is configured with resistors R10 and R11 to have a low
frequency gain of 100K/1K = 100 or 40dB.
To analyze the circuit, select Transient analyis from the Analysis menu. The Analysis Limits dialog box
for this circuit looks like this.
|

|
Note that we have specified a Time Range of 5/F0 = 5/1K = 5ms. Since F0 is the frequency of the
driving source the run will be for 5mS and the Fourier frequency resolution will be 1/5mS or 200 Hz.
Note also that we have specified the Maximum Time Step as .001*1/F0, which insures sufficient accuracy.
The use of .define statements like this lets you easily change the input frequency setings and have the
simulation run adjust accordingly. Press F2 and when the run is finished, select Transient menu / FFT Windows
/ Add FFT Window. The display will show the FFT Properties dialog. Click on the FFT tab and type 50 into
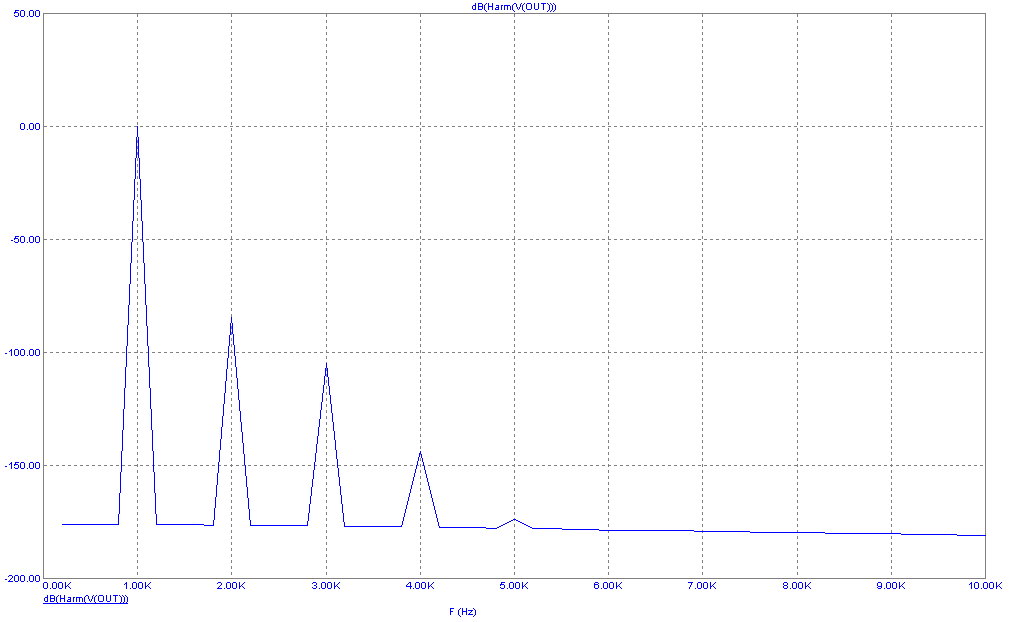
the Autoscale First ____ Harmonics field. The display should now look like this.
|

|
The window displays a plot of the dB value of the first 50 frequency values (50*200Hz=10KHz). Of these,
only multiples of F0 = 1KHz are significantly different from zero. Their values are as follows.
1KHz -0.111dB
2KHz -84.509dB
3KHz -104.665dB
4KHz -143.815dB
5KHz -173.725dB
There is no measurable value for higher harmonics. Is that all there is? Can no more information be
squeezed from the run? As it is no more can be gained.
To see the spectra with greater accuracy we
can do another run using a smaller time step. To illustrate the effect, set the Maximum Time Step to
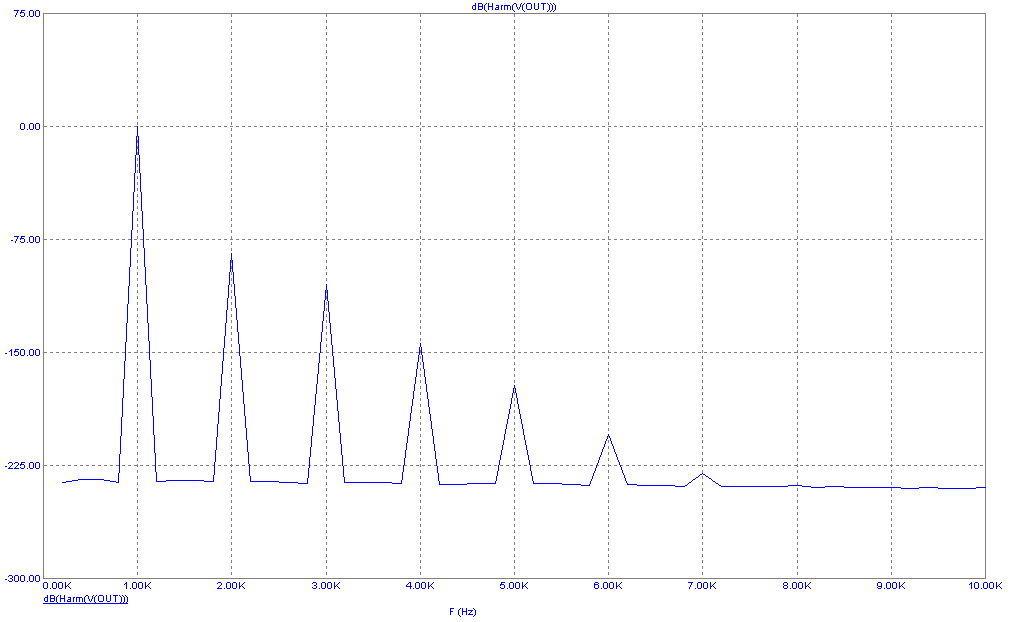
.0001*1/F0 or 10 times smaller than the last run. Now the plot looks like this.
|

|
The values of the 6'th and 7'th harmonics are now visible.
1KHz -0.111dB
2KHz -84.509dB
3KHz -104.662dB
4KHz -149.932dB
5KHz -171.883dB
6KHz -204.570dB
7KHz -230.253dB
The FFT routines are resolving a signal difference of about 230 dB, or a little better than 11 decimal
places. In particular the FFT is picking out a 1E-11 volt 7KHz signal out of a signal that contains a
1.0 volt 1KHz signal.
Note that the smaller timestep slightly changes the values of harmonics 3, 4, and 5. Usually this high
a degree of accuracy is not required and a maximum time step of .001*F0 is more than adequate. In
many cases, even .01*F0 is adequate for a rough estimate.
One thing to remember is that to reach the FFT Properties dialog you must first select the FFT window
by clicking on it. Normally after every run, the analysis plot is set to be the selected window. So if you
merely press F10 you'll get the Properties dialog box for the analysis plot, not the FFT window plot.
We've used the default FFT window settings except for the number of harmonics to be plotted, where
we asked for 50 instead of the default value of 10. What other changes could we have made? To see,
click on the FFT window, then press F10 to invoke the Properties dialog box. Click on the Plot tab
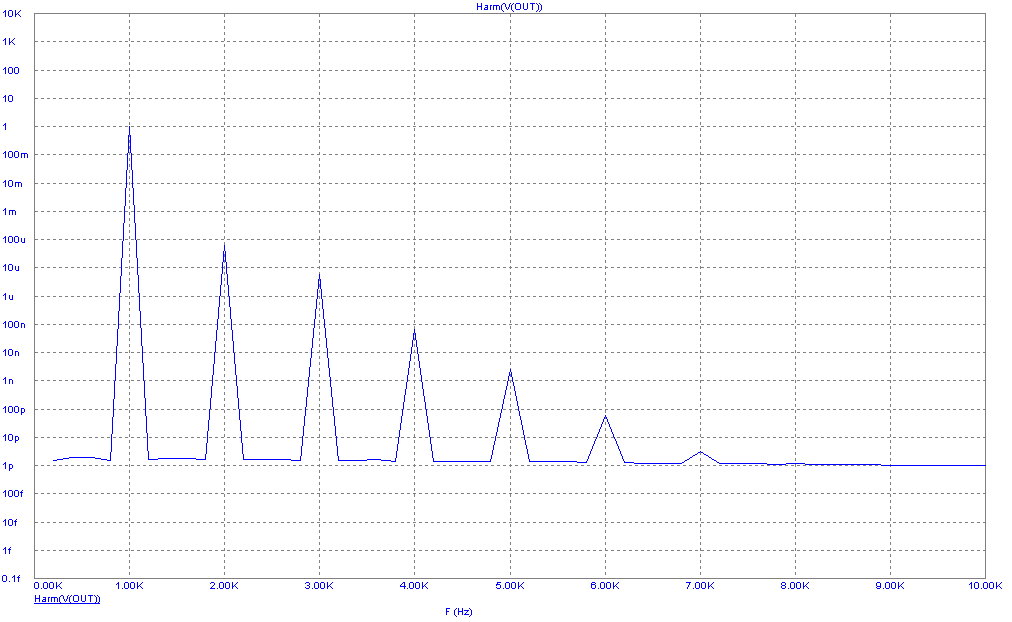
and select Harm under the What To Plot panel. This produces a plot that is similar to the one above
except that we're plotting the actual value of the spectra, not the dB representation. The vertical scale
has been changed from linear to log so the shape of the plot is very similar to the last one. The vertical
scale is annotated in powers of ten not in dB units.
|

|
|
|
|
|


