|
|
 |
Modeling a Warburg Impedance in AC Analysis
An electrochemical cell can contain a type of impedance referred to as the Warburg impedance which is created by diffusion
within the cell. The Warburg impedance represents semi-infinite linear diffusion within the solution and is represented
by the following expression:
Z = σ/(ω^1/2) - jσ/(ω^1/2)
where σ is the Warburg coefficient. The value of the Warburg impedance is dependent on the frequency of the perturbation. At
higher frequencies, the Warburg impedance is smaller since the reactants do not have as far to move. Conversely, at lower
frequencies, since the reactants have a greater length to travel, the Warburg impedance is higher.
In order to model this impedance in an AC analysis, the component used to model it must both be able to vary with frequency
and be able to handle a combination of real and imaginary values. One component that can do both of these is the NFI
(Nonlinear Function Current) source. The NFI source can handle complex, frequency varying expressions through its FREQ
attribute capability. The FREQ attribute is only active during an AC analysis and has no effect in any other type of
simulation. An expression defined within this attribute is evaluated at each frequency point of the simuation. The
following expression in the FREQ attribute would model the Warburg impedance.
V(G1)/((Aw/sqrt(2*PI*F)) - (j*Aw/sqrt(2*PI*F)))
Since the NFI output is a current, the above expression produces the equivalent current of the Warburg impedance based on the
basic I = V/Z relationship. The G1 instance in the expression is the part name of the NFI source in the schematic so it is
referencing the voltage across itself. The denominator of the expression is the Warburg impedance equation where Aw is the
Warburg coefficient.
Even though the FREQ attribute of the NFI source takes precedence during an AC analysis, the VALUE attribute of the NFI source
must also be defined. The value specified for the VALUE attribute will be used during the DC operating point calculation that
is performed at the beginning of the AC analysis simulation. The VALUE attribute may need to be set to an appropriate value
for some circuits. While the NFI will still work fine no matter what value is used, the rest of the circuit is linearized based
on the results of the DC operating point calculation. Therefore, the VALUE attribute can have an effect on what region of
operation the circuit is linearized to for the resulting AC analysis run. For this example, the VALUE attribute has been
defined as 0 which will create an open circuit during the DC operating point calculation.
In order to plot some of the basic Warburg impedance curves, an NFI source has been defined with the above FREQ expression. The
Aw coefficient for the expression is set to 300. The source is in series with a 20 ohm resistor that represents the charge
transfer resistance.
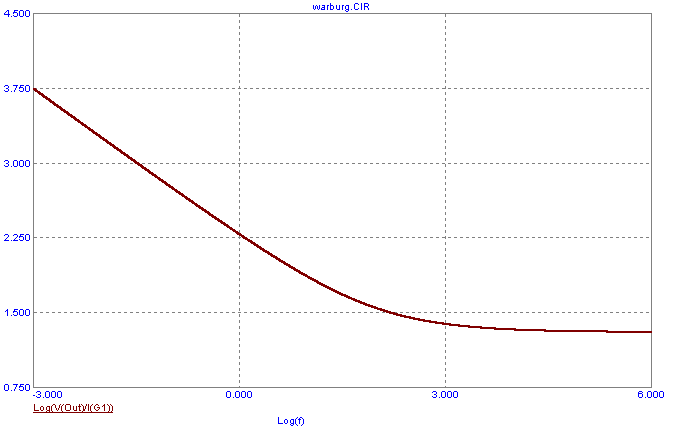
The first Warburg impedance curve is shown below. The Y expression is defined as Log(V(Out)/I(G1)). V(Out) measures the voltage
across both the NFI source and the series charge transfer resistance. I(G1) is the current through this branch. This expression plots
the log value of the impedance of the combination of the Warburg impedance and the series charge transfer resistance. The impedance is
plotted versus the log value of the frequency, Log(f). At lower frequencies, where the Warburg impedance dominates, the slope of the
impedance plot is -1/2. The -1/2 slope, which also appears as a 45 degree phase shift in phase plots, is characteristic of diffusion
impedances.
|

|
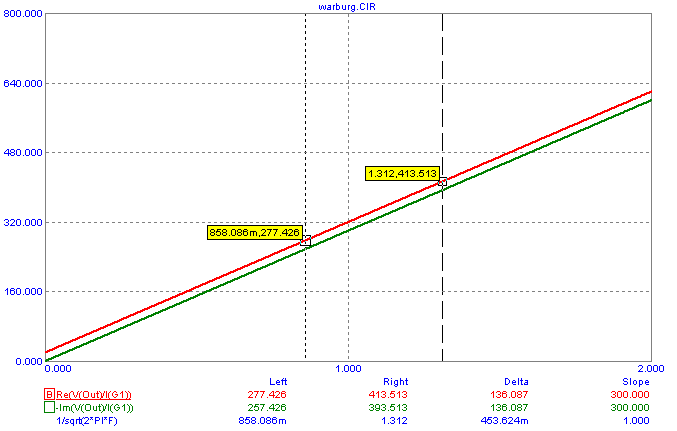
The other two basic Warburg impedance curves are shown below. In this case, the real and
imaginary parts of the Warburg impedance are plotted on the Y axis. These impedances are
plotted versus the expression 1/sqrt(2*PI*F) which is equivalent to 1/(ω^1/2). Once again,
the series charge transfer resistance is also factored into these curves. The real and
imaginary parts of the impedance are linear and parallel to each other as can be expected
by looking at the standard expression for the Warburg impedance. The imaginary part
intersects 0 when the frequency is 0. The real part intersects the value of the series charge
transfer resistance when the frequency is 0. In this case, that is 20 ohms. Note that the
slopes of both of these curves, which are displayed in the cursor tables below the plot, are
equivalent to the Warburg coefficient which has been set to 300 for this AC analysis simulation.
|

|
The technique of using an NFI source can be used with other frequency varying complex
impedances also. As long as one has an expression that models the impedance, the NFI
source can be used to model it in an AC analysis.
References:
1) http://www.consultrsr.com/resources/eis/warburg1.htm - Research Solutions and Resources LLC.
2) http://www.gamry.com/App_Notes/EIS_Primer/EIS_Primer.htm#About_The_EIS_Primer - Gamry Instruments
|
|
|
|
|


