|
|
 |
Enabling and Disabling Schematic Objects
Micro-Cap has the capability to disable components, grid text, and wires within a schematic.
Disabled objects are not included in any analyses, SPICE netlist translations, Bill of Materials
reports, or PCB netlists. This capability provides a nice technique to quickly reconfigure a
schematic without having to delete circuitry that may need to be used in future simulations. There
are three methods to enabling or disabling an object.
1) Double click on the object while in Select mode. In the dialog box that comes up, there will be an
Enable checkbox. When checked, the object is enabled, and when not checked, it is disabled. This
method lets you enable or disable a single object.
2) Select one or more objects. Under the Edit menu, there are two commands called Enable and Disable.
These commands will appropriately enable or disable all of the selected objects. These commands are
also available in the toolbar with the following icons:
 
3) Use the Region Enable mode which can be activated through the Options / Mode menu or by clicking on
the following icon:

Once the Region Enable mode is activated, the mouse can be used to box a section of circuitry. The Region
Enable dialog box will appear so that a boolean expression involving symbolic variables (those created
with a .Define or a .Param statement) can be defined for the region. When the boolean expression evaluates
to true, all objects originating within the region will be enabled. When the boolean expression evaluates
to false, all objects originating within the region are disabled. This lets you switch blocks of circuitry
back and forth between being enabled and disabled by modifying just a single symbolic variable.
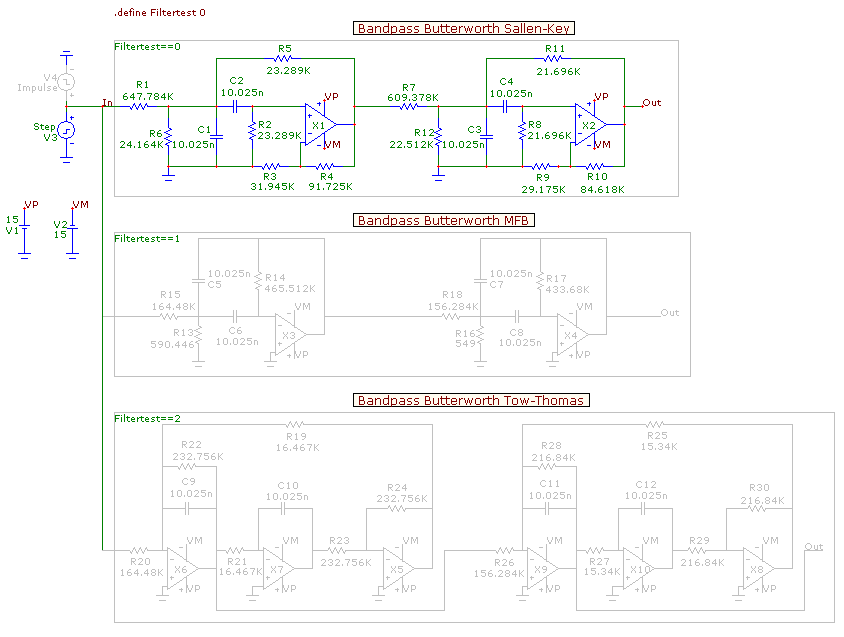
An example circuit that uses the enable/disable capability is shown below. The circuit contains three
different bandpass Butterworth filters. Each of these filters was created in the Active Filters design tool
in Micro-Cap. The specifications used for designing each of these filters were:
Gain = 0dB
Center Frequency = 1kHz
Order = 2
Q = 10
|

|
The only design specification that varied between the three filters was the type of
circuitry used to implement the stages of the filter. The top filter used the Sallen-Key
circuit type. The middle filter used the MFB (multiple feedback) circuit type. The
bottom filter used the Tow-Thomas circuit type.
When the active filter designer is set to implement the filter with ideal opamps and
exact resistor and capacitor values, the frequency response of each of these three filters
would be the same. To provide a little real world element to each of these filter
configurations, the Implementation page in the active filter designer has the Resistor
Values and Capacitor Values entries set to Combination. The Combination option finds
the best series / parallel combination of standard part values that approximates the exact
values that were originally calculated by the filter designer.
The combination values are not calculated by the filter designer until the filter is actually
created in the schematic. Once the filter is created, each resistor and capacitor will have
an attribute called Combination available in the Attribute dialog box that displays the results
of the combination calculation. For example, the 21.696K resistor in the Sallen-Key filter has
the following defined for the Combination attribute.
21.696K = 21.5K+196 (e=-0.0073% n=2)
This means that the closest combination is achieved by a 21.5kohm resistor in series with a
196ohm resistor. This calculation produces a result that is within -.0073% of the exact value
that the filter designer calculated. There will also be a page called Standard Values that is
added to the schematic file which provides a general report of the combination calculations for
all of the corresponding components. Even though the impedance values vary by a small percentage
with the Combinations option, the effect on the frequency response is quite noticeable.
In the schematic, each of the filters share the same input and power supplies. There are actually
two voltage sources at the input. The V3 voltage source defines a step signal, and the V4 voltage
source defines an impulse signal. Having both of these sources present in the schematic provides
a quick way to switch between a step response and an impulse response in transient analysis. Of
course, one of these sources must be disabled when an analysis is run. At this point, the V4 source
has been disabled through the use of the Disable command under the Edit menu. This source appears
in the schematic with a grey color. The color used for disabled components can be controlled in
the Color/Font page of the Properties dialog box.
The Region Enable mode has been used to define the region around each of the filters with a boolean
expression that determines whether the region will be enabled or disabled. The regions have been
defined with the following boolean expressions:
Sallen-Key:
Filtertest == 0
MFB:
Filtertest == 1
Tow-Thomas:
Filtertest == 2
The Filtertest variable has been set using the following define statement:
.define Filtertest 0
Using a common variable in the above boolean expressions ensures that only one region at a time will
be active. When the Filtertest variable is set to 0, the Sallen-Key filter will be enabled. When the
Filtertest variable is set to 1, the MFB filter will be enabled, and when the Filtertest variable is set
to 2, the Tow-Thomas filter will be enabled. If the Filtertest variable is set to any other value, all
three of the filters will be disabled. The boolean expressions for regions can be more complex than the
previous examples, but any variables used must be static variables that have been set through define or
param statements. Dynamic variables such as voltages and currents are not allowed in the expressions.
When a variable used in a boolean expression is modified in the schematic file, the schematic will update
accordingly. Initially, the Filtertest variable is set to 0 so that the Sallen-Key filter is enabled.
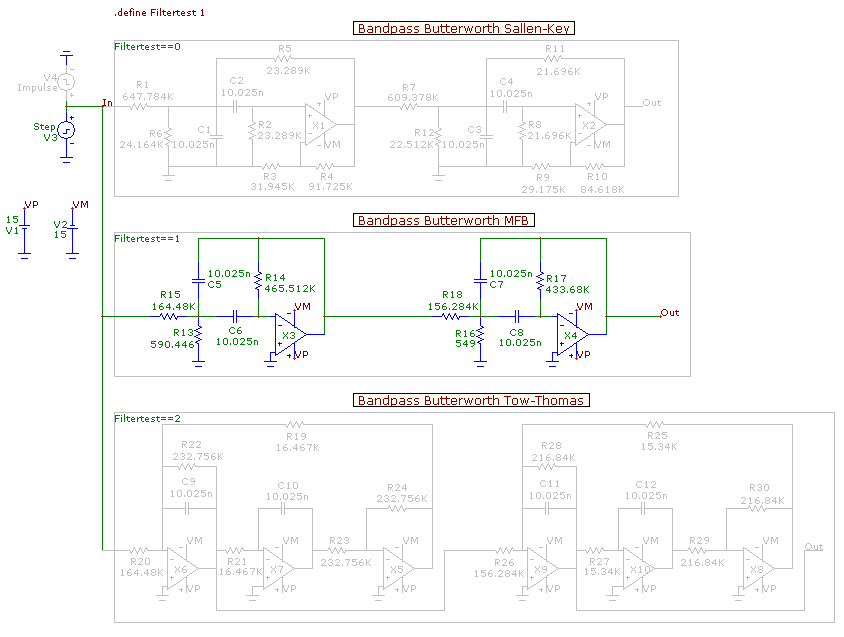
If the Filtertest define statement is modified so that the variable is now set to 1, the schematic will
appear as below. The MFB filter is now shown as enabled while the Sallen-Key filter is now drawn with
the specified disabled color.
|

|
Symbolic variables used within the region enable boolean expressions can also be stepped in an analysis.
This provides the capability to easily analyze different schematic configurations in the same analysis.
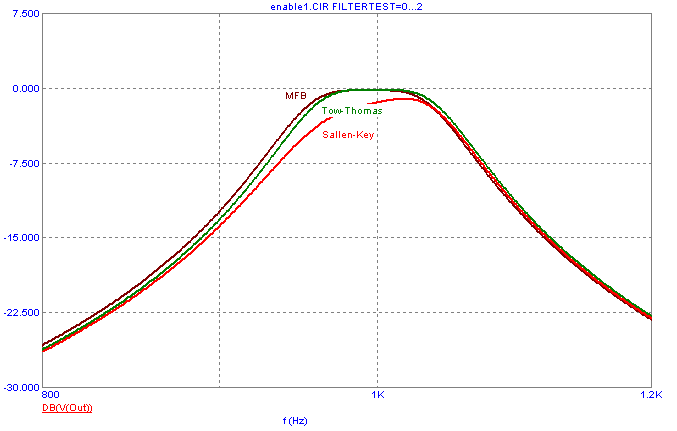
In this example, the Filtertest variable is stepped in AC analysis. Filtertest is stepped through the
values of 0, 1, and 2. The analysis will produce the frequency responses of the different circuit types.
The resulting simulation is shown below.
|

|
Since the regions have been defined so that only one at a time can be active, the output nodes for each
of the filters share the node name Out as there is no danger in creating an unintended circuit connection.
This makes plotting the filter output easier since a single expression can be used in the analysis limits
no matter what filter region is enabled. In this case, specifying dB(V(Out)) in the analysis limits plots
the output voltage in decibels of all three filter configurations.
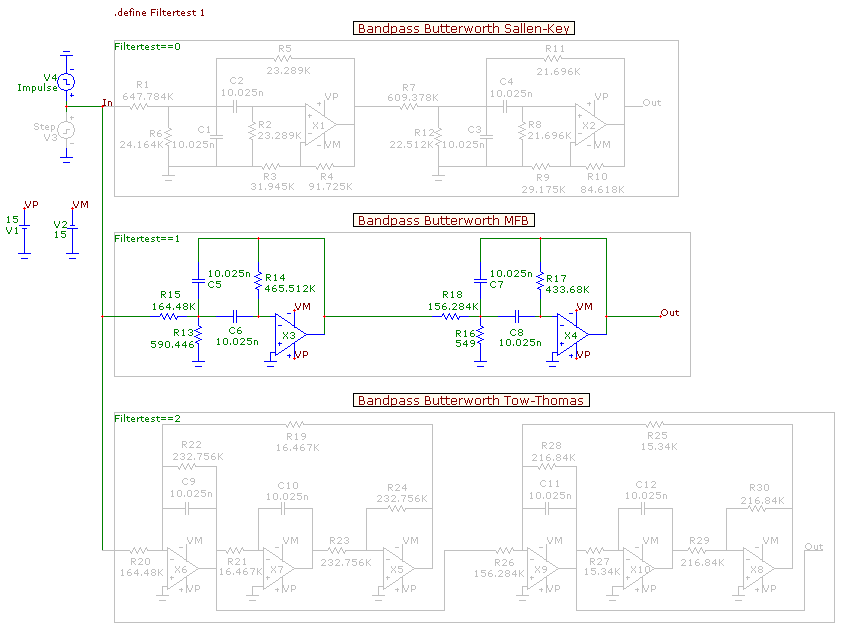
For a transient analysis, the step response source is currently enabled. To quickly switch to the impulse
response source, the V3 source is first selected. The Disable command is selected under the Edit menu.
The V3 source is now shown in the schematic as disabled. Next, the V4 source is selected. The Enable
command is selected under the Edit menu. The V4 source is now enabled for operation and the schematic
appears as below. If these Enable and Disable commands are going to be used often, it could be worthwhile
to create shortcut keys for the commands in the Shortcuts section of the Preferences dialog box.
|

|
Running transient analysis on the schematic produces the results below. This plot displays the impulse response
of the bandpass Butterworth filter. Since the Filtertest variable is set to 1 in the schematic, the MFB
circuit type is the one that is analyzed.
|
|
|
|
|


