|
|
 |
Using the Waveform Buffer
Micro-Cap 9 provides a feature that can easily display waveforms within an analysis plot that have
been saved from previous runs or even from simulations of other circuits. The Waveform Buffer
provides the capability to store and retrieve waveforms. The buffer can be used with waveforms
created in transient, AC, DC, or distortion analysis.
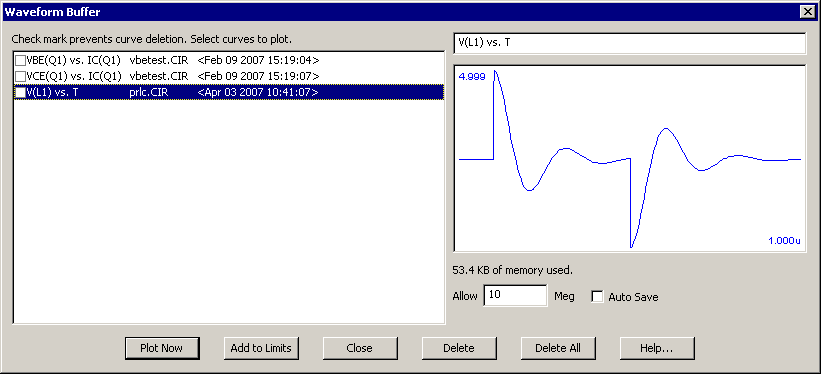
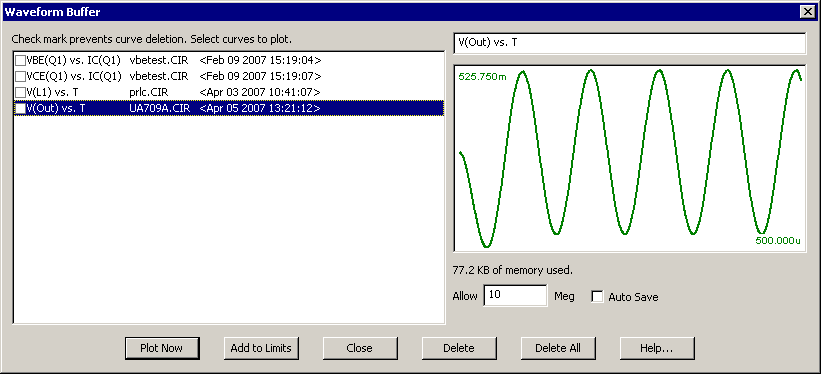
The Waveform Buffer is available under the Scope menu when in an analysis. The dialog box appears
as below:
|
|
The list displays the waveform labels, the circuit name from which they came, and the date and time
they were stored in the Waveform Buffer. A check box adjacent to the label protects the waveform
from deletion. The plot on the right provides a view of the selected waveform. Above the plot
is a field to edit the waveform label. The other interesting functions of the dialog box are as
follows:
Plot Now: This immediately adds the selected waveforms to the analysis plot and places entries
into the analysis limits so the waveforms are displayed in future runs also.
Add to Limits: This places entries in the analysis limits for all selected waveforms so that they
will be displayed the next time the simulation is run.
Delete: This deletes the selected waveforms whose check boxes adjacent to the waveform name have
not been enabled.
Delete All: This deletes all waveforms whose check boxes adjacent to the waveform name have not
been enabled.
Auto Save: When enabled, the auto save will save all waveforms from every analysis run into
the buffer. As you can imagine, this will use up space after a while so the Allow Meg field
specifies how much memory is available to the Waveform Buffer. Once this limit is reached,
waveforms will be deleted starting with the oldest to make room for the newer waveforms. Again,
the check box adjacent to the curve name will protect the waveform from being deleted if it is
enabled.
Waveform Buffer Examples
The waveform buffer is simple to use. For the following example, the UA709 amplifier has been set
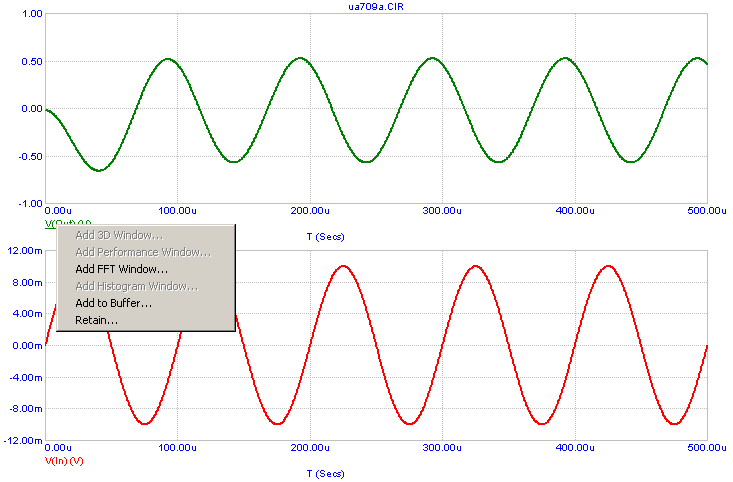
up to operate with a gain of 100. A transient simulation was then run. Once the simulation is
finished, right clicking on a waveform name invokes the popup menu shown below.
|
|
Two of the entries in the popup menu are applicable to the Waveform Buffer. Add to Buffer
will store the selected waveform in the Waveform Buffer. Retain stores the selected waveform
in the Waveform Buffer and also adds an entry in the analysis limits so that the saved waveform
will be plotted in future runs. The Add to Buffer and Retain capabilities are also available
under the Scope / Waveform Buffer menu. For this example, the Retain command was selected from
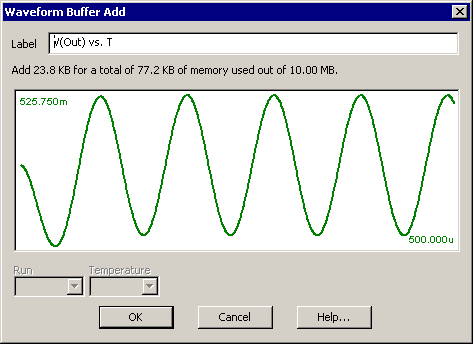
the menu for the V(Out) waveform. The following dialog box is then invoked.
|
|
This dialog box lets you edit the label for how the waveform will be listed in the Waveform
Buffer. If the simulation has produced multiple runs such as with Stepping, you can select
which branch will be stored. In this instance, the waveform label is defined as V(Out) vs. T.
Clicking OK saves the waveform in the buffer. Since Retain was selected, the following entry was
also made in the analysis limits as a new Y Expression to be plotted:
Buffer("V(Out) vs. T")
This expression has been assigned to the same Plot Group as the original V(Out) waveform. Now when
the transient analysis is run again, the V(Out) vs. T waveform will be retrieved from the Waveform
Buffer and plotted so it can be compared to subsequent plots of V(Out).
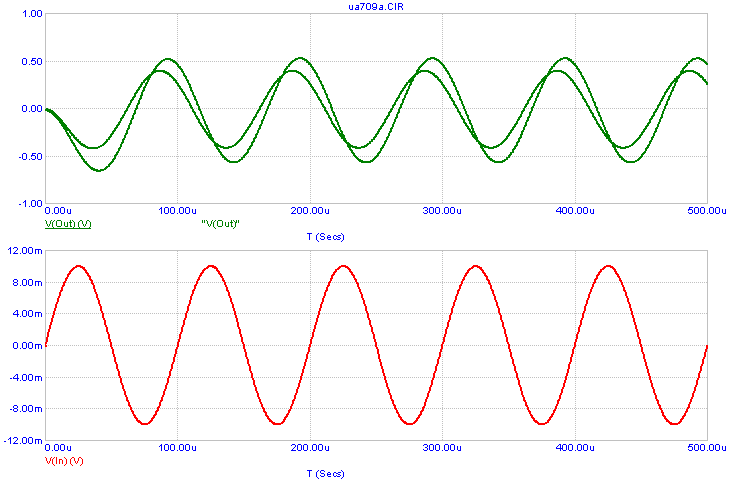
In the schematic, the feedback resistor has been modified from 100kohm to 50kohm so that the opamp
now produces a gain of 50. The resultant transient simulation below displays the
modified V(Out) waveform versus the retained V(Out) waveform. Note that when a waveform is
retrieved from the Waveform Buffer, its waveform expression in the plot is enclosed with quotation
marks. It will now be easy to compare any future output waveform versus the original output
waveform.
|
|
Since the V(Out) vs. T waveform is stored in the Waveform Buffer, it can be imported into any
transient, AC, DC, or distortion analysis for any circuit.
For a second example of using the Waveform Buffer, the same circuit with the UA709 amplifier
will be used. The feedback resistor has been restored to its original 100kohm value. In this
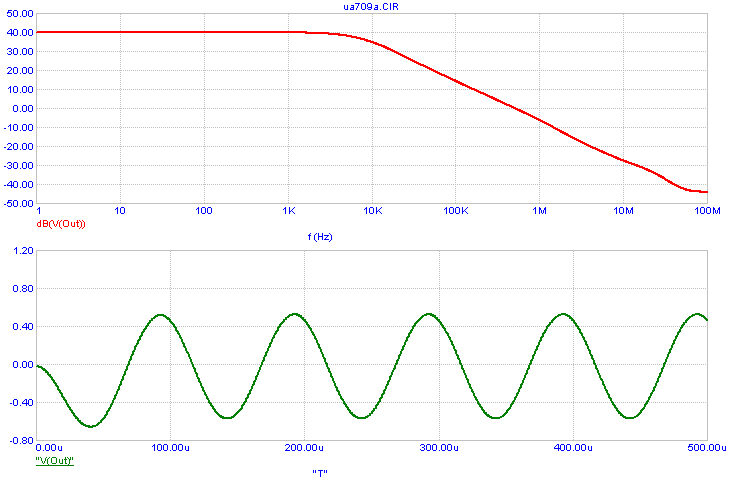
case, an AC simulation is run, and the expression dB(V(Out)) is plotted. Once the AC analysis
is finished, the Waveform Buffer is invoked. As shown below, the V(Out) vs. T waveform
previously stored from the transient analysis is now available. This waveform is selected and
the Plot Now button clicked. The transient output voltage will then be plotted alongside the AC
results as shown in the following simulation.
|
|
|
When plotting a waveform from the buffer, an entry is always made in the analysis limits so that
the waveform will automatically be displayed in future runs. To delete this waveform for any
subsequent runs, simply delete that entry within the analysis limits.
When a waveform is stored in the buffer, the color, width, pattern, and style of that waveform
are also stored. These will be the default entries for the waveform when it is initially
retrieved from the buffer. Once retrieved, the waveform properties can be modified through the
analysis limits or the Properties dialog box like any other waveform in the plot.
|
|
|
|
|


