|
|
 |
Lead Acid Battery Macro
The standard battery component available in Micro-Cap is an ideal battery that provides a constant voltage over
any length of time and with any current. For some simulations, a battery model may be needed that discharges over
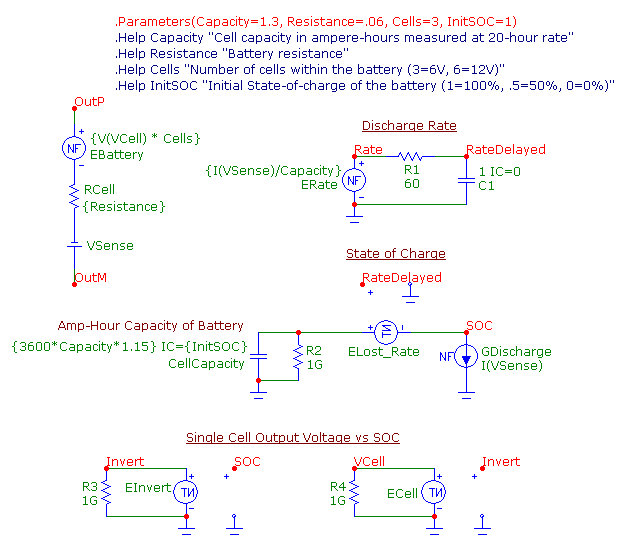
the course of the analysis. The lead acid battery macro that appears in the figure below provides a model that
simulates the discharge characteristics of a battery. This model was derived from the articles "Simple PSpice
models let you simulate common battery types" in the October 28, 1993 issue of EDN and "PSpice models
nickel-metal-hydride cells" in the February 15, 1996 EDN Design Ideas Supplement. Both articles were written
by Steven Hageman.
|

|
The macro circuit has four parameters that are passed through to it: Capacity, Resistance, Cells,
and InitSOC. The Capacity parameter defines the nominal capacity of the battery measured at the
20 hour rate. It is defined in units of Amp-hour. The Resistance parameter defines the internal
resistance of the battery. The Cells parameter defines the number of cells that comprise the
battery. 3 cells model a 6V battery and 6 cells model a 12V battery. Finally, the InitSOC parameter
defines the initial state of charge that the battery will start the simulation with. A value of 1
means the battery is 100% charged and a value of 0 means that no capacity remains.
The discharge rate of the battery is calculated by the ERate nonlinear function voltage source
(NFV). It is defined with the following equation:
{I(VSense)/Capacity}
where I(VSense) is a measurement of the current through the battery which is divided by the
nominal capacity of the battery to produce the discharge rate. The voltage at node Rate is
equivalent to the instantaneous discharge rate of the battery in C units. The R1 and C1
combination provides a 60 second RC time constant. This delayed voltage is then fed into
the input of the table source ELost_Rate which lowers the cell capacity at high rates of
discharge. The TABLE attribute of the ELost_Rate source has been defined as:
(0.05,0.0) (0.089,0.11) (0.16,0.20) (0.62,0.39) (0.8,0.47) (1.6,0.44)
At greater discharge rates, the state of charge will be lowered by the amount specified in the
table. Values between data points are linearly interpolated. The CellCapacity capacitor is
used in conjunction with the GDischarge current source and the ELost_Rate table source to
calculate the state of charge of the battery. The CellCapacity capacitor has its CAPACITANCE
attribute defined as:
{3600*Capacity*1.15} IC={InitSOC}
The capacitance is determined by the Capacity parameter muliplied by 3600 to convert the
Amp-hour value to Amp-second. The 1.15 multiplier is an adjustment multiplier that helps
account for the manufacturer's specified capacity versus the 0 volts this model produces at
no capacity. The IC statement defines the initial state of charge through the InitSOC
parameter. The GDischarge current source reproduces the current through the battery,
I(VSense), in order to discharge the capacitor. Essentially, the voltage stored in the
capacitor minus the voltage across the ELost_Rate source produces a voltage at node SOC that
is equivalent to the state of charge of the battery.
The EInvert table source inverts the voltage at node SOC. It does this through a simple
table definition of:
(0,1) (1,0)
Since the input voltage should always be between 0 and 1, this table definition is equivalent
to the equation (1-V(SOC)). When the state of charge is at 1 (100%), the output of this source
will be 0V. This inverted voltage is then used as the input to the ECell table source. The
ECell source sets the single cell voltage value versus the inverted state of charge value.
The source has its TABLE attribute set through the following define statement:
.define CellV
+ (0.000E+00 2.171E+00) (5.222E-04 2.149E+00) (1.828E-03 2.128E+00)
+ (1.263E-01 2.101E+00) (4.908E-01 2.001E+00) (6.385E-01 1.949E+00)
+ (7.459E-01 1.900E+00) (7.834E-01 1.875E+00) (8.117E-01 1.850E+00)
+ (8.313E-01 1.826E+00) (8.436E-01 1.801E+00) (8.517E-01 1.773E+00)
+ (8.556E-01 1.750E+00) (8.591E-01 1.724E+00) (8.616E-01 1.702E+00)
+ (8.646E-01 1.676E+00) (8.677E-01 1.648E+00) (8.707E-01 1.623E+00)
+ (8.732E-01 1.600E+00) (8.850E-01 1.499E+00) (8.965E-01 1.401E+00)
+ (9.000E-01 1.333E+00) (1.000E+00 0.000E+00)
When the state of charge is 100%, the input voltage to the table is 0V so that the output
voltage of the table source would then be 2.171V. Similarly, if the state of charge drops
to 51%, the input voltage to the table would be .49V so that the output voltage of the table
source would be approximately 2V.
The EBattery NFV source, RCell resistor, and VSense battery model the actual battery device.
The VSense battery, previously referenced, is a 0V battery used to measure the current through
the battery. The RCell resistor models the internal resistance of the battery and is defined by
the Resistance parameter. Finally, the EBattery source models the output voltage of the battery.
Its VALUE attribute is defined as:
{V(VCell) * Cells}
The equation multiplies the voltage at node VCell by the number of Cells that are passed through
as a parameter to the macro to produce the battery voltage.
Obviously, the table values for ELost_Rate and ECell along with the multiplier in the CellCapacity
capacitor may need to be modified when simulating specific batteries but this should provide a
good general model of the lead acid battery.
A simple circuit was created to test the macro. The battery macro is discharged by a constant
current source of 50mA. The parameters of the macro have been defined as follows:
Capacity=1.3
Resistance=.12
Cells=6
InitSOC=1
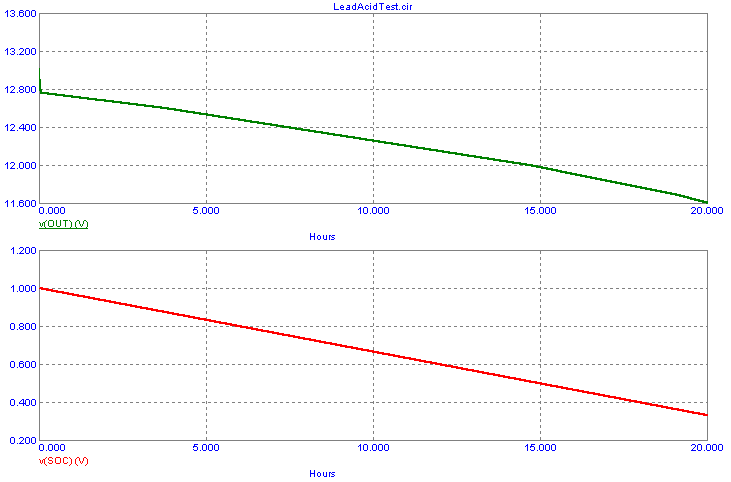
The resultant transient analysis is shown below. The simulation was run with a time
range of 72000 seconds or 20 hours. The X axis uses the variable Hours which was created with
the following define statement:
.Define Hours T/3600
The top plot displays the output voltage of the battery and shows the voltage decaying down to
11.6V by the end of the simulation. The bottom plot shows the state of charge of the battery.
It starts at 1 which is the value set by InitSOC, and at the end of 20 hours, the state of charge
is down to around .33V or 33%.
|

|
|
|
|
|


