|
|
 |
Smith Chart and Impedance Plots
The Smith chart provides a means to view both the complex reflection and the complex impedance of a port.
It is most applicable when designing in the RF range for applications involving transmission lines, amplifiers,
and antennas among others. One common usage for the Smith chart is to view the input impedance at a
port. This article describes the method for correctly plotting the input impedance to a Smith chart
in Micro-Cap.
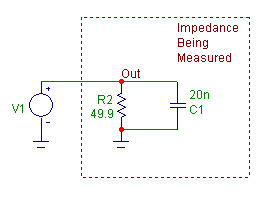
For this example, we will use a simple parallel RC combination since the impedance waveform for that
configuration is well known. The initial circuit is displayed below. It consists of the RC
combination and a Voltage Source component whose AC magnitude parameter is defined as 1V.
|

|
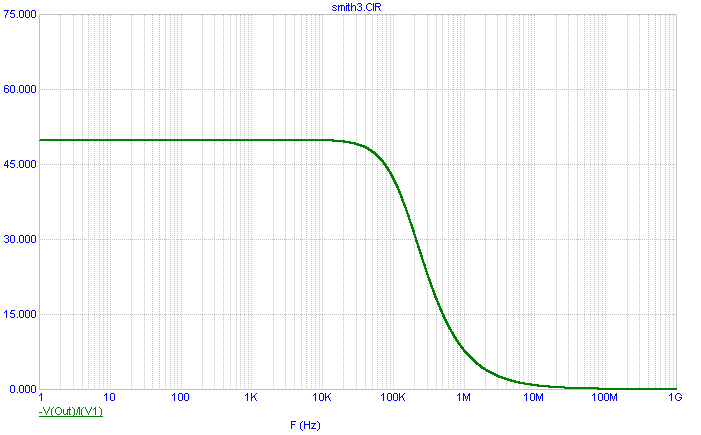
For a standard Cartesian plot, the V/I equation can be used to plot the impedance. In this case, the
impedance would be measured using the following expression:
-V(OUT)/I(V1)
which divides the voltage across the input port by the current going into the port. The negative sign
is to account for the fact that the I(V1) is calculated from the positive node to the negative node of
the source which would be flowing out of the port. The AC analysis of this plot is displayed below.
At low frequencies, the impedance is dominated by the resistance, and at high frequencies,
the capacitor impedance dominates. The most common error when trying to plot the impedance in a Smith
chart is to use this same technique.
|

|
In order to plot the complex impedance in a Smith chart, the expression that needs to be plotted is the S
parameter equivalent. The S11 parameter represents the input impedance and the S22 parameter represents
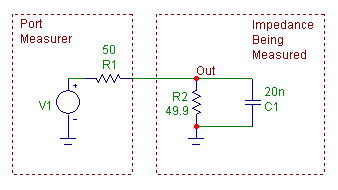
the output impedance. To measure the S11 parameter, the circuit will need to be slightly modified as shown
below. A resistor has been added between the voltage source and the impedance to be measured. The value of
this resistance will determine the normalization factor that is used when creating the Smith chart.
|

|
For this circuit, the S11 parameter is determined by the following equations:
b1 = S11*a1 + S12*a2
a1 = Normalized incident voltage at port 1=(V(Out)+R1*I(R1))/(2*sqrt(R1))
b1 = Normalized reflected voltage at port 1=(V(Out)-R1*I(R1))/(2*sqrt(R1))
a2 = 0 when measuring S11
This reduces the equation to:
S11 = (V(Out)-R1*I(R1)) / (V(Out)+R1*I(R1))
From Kirchoff's law, we determine the voltage loop at the input as:
-V(V1) + R1*I(R1) +V(Out) = 0 where V(V1) is 1 volt for the AC analysis
Plugging this back into the S11 equation, the final expression becomes:
S11 = 2*V(Out) - 1
The resultant Smith chart when plotting this expression is displayed below. Note that this plot has been
normalized to the source resistance of 50 ohms. The impedance plot starts approximately at the real,
imaginary values of 1,0. It then arcs through the capacitive half and ends at the short circuit point of
the Smith chart as would be expected by a parallel RC impedance.
|
|
|
|
|


