|
|
 |
Creating And Using User Source Files
The user source file provides a powerful method for importing analysis waveforms
contained within a file. There are two main uses for a user source file in Micro-Cap.
The first is to use the file with a user source to create an input voltage in a schematic.
Unorthodox waveforms that can't be easily represented with standard Micro-Cap sources such
as the sine or pulse source can be imported with this method. The second use is to replot
the waveform during another analysis run using the CurveX or CurveY operators. Replots can
be used in order to compare waveforms from different runs or even different
schematics.
Creating A User Source File
Since the user source file is an ASCII text file, a file can be created through any text
editor just by implementing the correct header and data format. The header can be
created simply by copying and pasting from one of the existing .USR files available
in the DATA directory and making a few basic edits for the number of data points and
the waveform names. A previous newsletter article in the Fall 2002 issue described the
process of converting an Excel file into a user source file and details the format needed
to manually create a user source file. For this article, we will cover the most common
method of creating such a file by using the Save Curves options in the Analysis
Properties dialog box.
To be able to access the Save Curves option, a simulation must first be run. The Save
Curves option in the Properties dialog box is available in transient, AC, and DC analysis
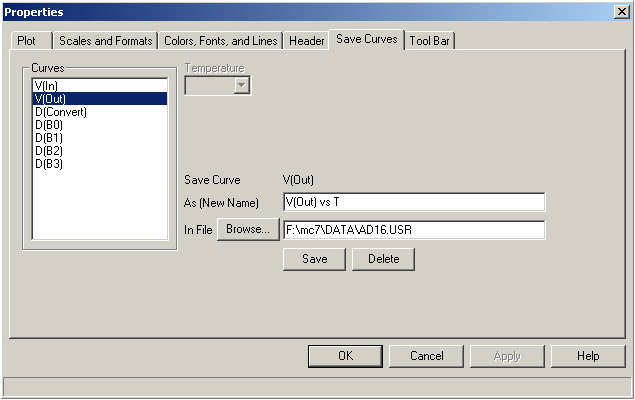
only after a simulation has been performed. The Save Curves page appears below. The
simulation used as an example in this case is the transient analysis of the AD16.CIR
file that is distributed with Micro-Cap. The AD16 circuit takes an input NFV source and
funnels it through 16 bit AtoD and DtoA components to produce a sampled analog waveform at
the output. The waveform we are interested in saving is the output of the DtoA component
which would be quite a laborious task to reproduce in another schematic using the standard
sources.
|

|
On the left hand side of the Save Curves page is a list of all of the available waveforms
that may be saved to a user source file. Simply select the waveform that is to be saved
to the file. If there are any stepping or Monte Carlo runs in the analysis, drop down
lists will appear at the top of the page that let one specific waveform be chosen out
of the family of runs. The As (New Name) field lets the user specify the name that the
waveform is to be assigned to within the user source file. This name will be used when
the waveform is imported through a User Source or through the CurveX and CurveY
operators. The In File field specifies the name and location of the file that the
waveform information will be stored in. Multiple waveforms may be stored in one
file. The Save button will save the waveform to the specified file. If a waveform
already exists with the same name in the specified file, it will be overwritten. The
Delete button lets any waveform that already exists in the specified file be
deleted.
For the AD16.CIR example, highlight the V(Out) waveform in the Curves list. For the name
and file, the default values will be used as follows:
Name: V(Out) vs T
File: AD16.USR
Finally, click the Save button, and the V(Out) waveform will be saved to the
AD16.USR file.
Importing As A Voltage Source Input
The User Source, which is available in the Analog Primitives/Waveform Sources section
of the Component menu, provides the capability to import waveforms from the user
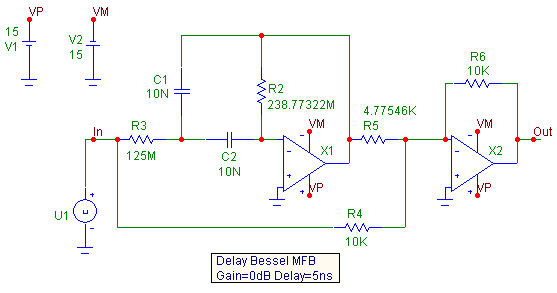
source file and use them as voltage sources in a schematic. The schematic below
displays an example circuit with a User Source as the input. The User Source voltage
is being fed into a delay Bessel filter that has a 0dB gain and a delay of 5ns. To
import the waveform that was saved from the AD16 circuit, the User Source has its
attributes defined as:
FILE: AD16.USR
EXPRESSION: V(Out) vs T
|

|
The FILE and EXPRESSION attributes have been defined to match the entries from the Save
Curves page. Clicking the drop down arrow next to the Value field, when the FILE or
EXPRESSION attribute is selected, displays a choice of available files or waveforms
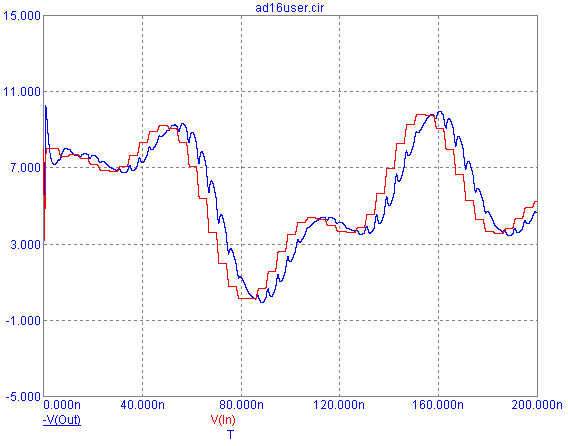
within a specified file, respectively. The resulting transient analysis is displayed
ibelow. Note that the voltage at node In is the output voltage waveform from the AD16
circuit.
|

|
Importing As A Plotted Waveform
A user source waveform can also be plotted directly in the analysis through the use of
the CurveX and CurveY operators. For the AD16 waveform, setting the Y Expression in the
Transient Analysis Limits dialog box to:
CurveY("AD16","V(Out) vs T")
will import the waveform directly into the analysis. A simple technique to define the
Curve operator is to do a right mouse click in the Y Expression field, which will invoke
an expressions menu. One of the topics in the menu is Curve which provides a listing of
all available user source file waveforms in the current data directory.
|
|
|
|
|


