|
|
 |
Optimizing AC Analysis Frequency Step Sampling
AC analysis is a linear, small signal analysis. This means that all circuit variables
are assumed to be linearly related. Due to the linearity, there is not an internal
data step control such as can occur in transient analysis when increased data sampling
is needed. For some AC runs, particularly simulations involving narrow band operation,
the frequency step sampling can have a significant impact on the final plot results. The
frequency step sampling is controlled by combinations of the Frequency Step option, the
Number of Points field, and the Maximum Change % field in the AC Analysis Limits dialog
box as follows:
Frequency Step is Auto: This method uses the first plot of the first group as a
pilot plot. If, from one frequency point to another, the plot has a vertical change
greater than the Maximum Change % of the Y scale, the frequency step is reduced,
otherwise it is increased.
Frequency Step is Linear: This method produces a frequency step such that, with a
linear X scale, the data points are equidistant horizontally. The Number of Points
field determines the total number of data points that will be calculated.
Frequency Step is Log: This method produces a frequency step such that with a log X
scale, the data points are equidistant horizontally. The Number of Points field
determines the total number of data points that will be calculated.
Frequency Step is List: This method calculates data points only at the frequencies
specified in the comma-delimited list within the Frequency Range field. There is no
frequency step.
The Number of Points field will also be available if numeric output is enabled for any
waveform, but if the Frequency Step is set to Auto, it will just interpolate data points
in the numeric output, not force more data points to be calculated. Only when the
Frequency Step is set to Linear or Log is the Number of Points field used to determine
the number of data points calculated.
The default Frequency Step is set to Auto since this normally produces the best
simulations for any frequency range. However, some AC analysis simulations need a
greater number of data points to be adequately sampled than the default settings
produce. Narrow band circuits in particular must have data sampled through the narrow
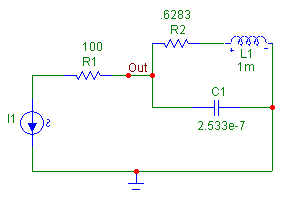
band range of frequencies to produce a complete analysis. The schematic below is
one such circuit. This schematic has a 1A AC current source at its input. In series with
this source is a 100 ohm resistor which is then connected to a two branch parallel
resonant network.
|

|
The desired output in AC analysis for this circuit is to measure the impedance of the
resonant frequency. Since the I1 current source has been defined as a 1A source, the
voltage at node Out will be equivalent to the resonant network impedance. The impedance
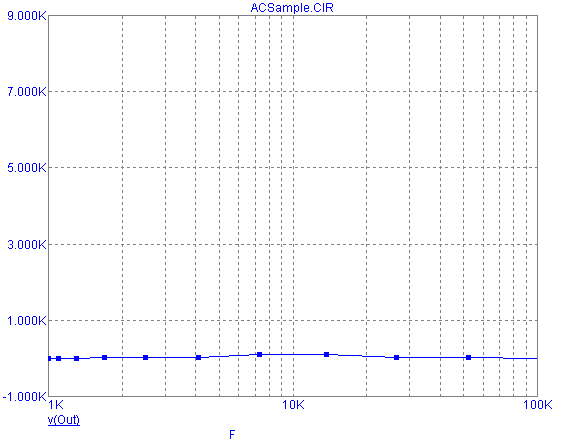
for the circuit has a very narrow resonant peak that occurs at 10kHz. The plot below
shows the AC simulation when the frequency step is Auto and the Maximum Change % is 5
which are both the default settings in Micro-Cap. The expected resonant peak is not
apparent in the simulation. The View Data Points option for the simulation has been
enabled. As can be seen in the figure, very few data points are being calculated in
this run. The resonant frequency has been bracketed with one data point at 7.3kHz and
the next data point at 13.7kHz so the entire resonant area is being skipped over. The
area between the data points is just straight line interpolation. Since the simulation
is flat at the start of the run, it easily falls within the 5% Maximum Change % versus
the Y axis. Each time it meets this criteria, the frequency step is increased. By the
point of the resonant frequency, the frequency step is large enough that it never samples
in that area. The actual data points that are being calculated are perfectly correct.
The problem is that not enough data points are being calculated.
|

|
One solution to increase the number of data points is to use the Log frequency step and
to increase the Number of Points value. The Log step is chosen over the Linear step
in this case because the frequency range of the simulation spans a couple of decades, and
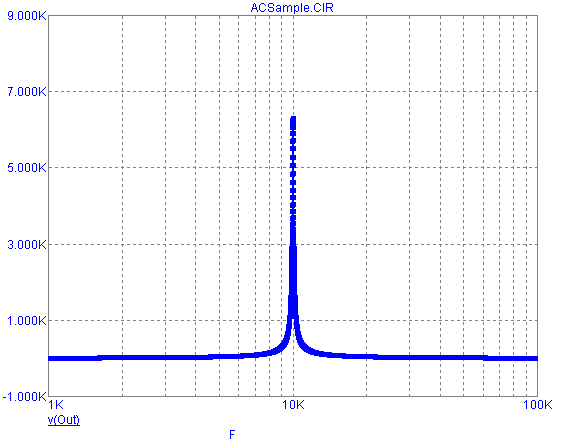
the X Axis is set to a log scale. The Number of Points field is set to 10001 to ensure a
fine sampling during the analysis. The subsequent simulation is displayed below. Note
the dramatic increase in the number of data points that have been calculated versus the
original simulation. The resonant frequency is now very obvious.
|

|
While the Log frequency step and the Number of Points field were used in this case,
making the Maximum Change % smaller in conjunction with the Auto frequency step would
also have increased the accuracy. Setting the Maximum Change % to .1 would have
created a comparable simulation. The Log and Linear frequency steps do have the
advantage of producing a consistent data sample throughout the entire frequency range.
There is no one frequency step combination that will be correct for every simulation. Much
depends on the frequency range that the circuit is being simulated across and the type of
operation the circuit performs. Enabling the Data Points in the View section under the
Scope menu gives a good idea of the frequency sampling that is being performed and makes
it easy to determine if the number of data points needs to be increased.
|
|
|
|
|


