|
|
 |
Measuring Phase Margin
|
Ever wanted to measure phase margin? It's simple. We'll demonstrate with this sample circuit:
|
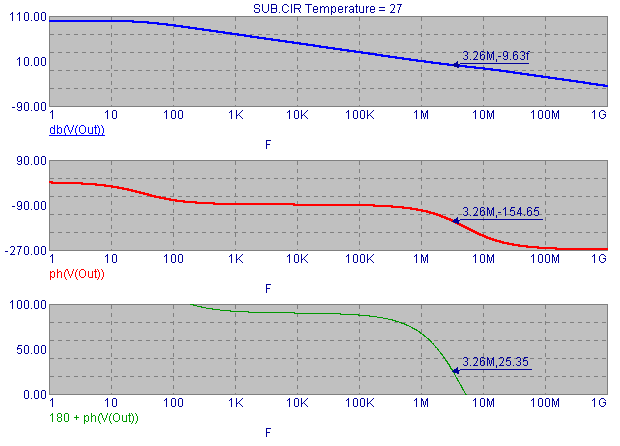
Here is the AC analysis, showing the gain in dB, the phase in degrees, and the phase margin in degrees. Phase margin is the difference in the phase value and -180 degrees, or mathematically it is:
Phase Margin = PH(V(OUT)) - (-180) = PH(V(OUT)) + 180
|

|
To measure the phase margin conveniently do the following:
1) Run AC analysis.
2) Select the Go To Y item from the Scope menu. When the Go To Y dialog box comes up, specify a Y value of 0. Click on the Left button. Click on the close button. This positions the left cursor on the dB(V(OUT)) waveform where its value is 0. Since the Align Cursors option is enabled, it will also position the left cursors for the phase and phase margin graphs, enabling us to read the phase margin directly from the Left column of the table below the plots. In this case, the phase margin is read off as 25.25 degrees.
3) After positioning the cursors, you can mark the values by selecting the Tag Left Cursor command from the Scope menu. This command tags the left cursor of the selected waveform, so you must select each waveform (click on the waveform name) before using this command.
The figure shows the plots with tags attached, marking and measuring the phase margin.
Why does the upper waveform, V(OUT), have a tag value of -9.63f, when we requested a value of 0.0? Well -9.63f is 9.63e-15 which is very nearly zero. The program interpolates between the calculated data points to position the cursor as close as possible to the requested location. The small difference is the result of that interpolation.
|
|
|
|
|


