|
|
 |
Monte Carlo Error Reports
Monte Carlo analysis provides a means of viewing how the circuit performance can be affected by parameter variation. The analysis performs a specified number of simulation runs varying the circuit randomly within the tolerances defined in the schematic. This is in order to ensure that the circuit will behave within acceptable limits while accounting for the possible variation in component values within the tolerance band. When setting up the Monte Carlo analysis options, it is possible to set an error limit that will report in the numeric output when the circuit violates the performance criteria. Micro-Cap also has the capability to convert the error report into a schematic using the component values that cause the error.
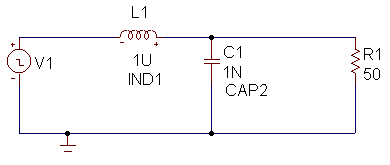
The circuit below is a simple RLC circuit. The pulse source input is a 5V pulse with a pulse width of 400ns and a repetition period of 1us. The pulse is in series with a 1uH inductor which then feeds to a parallel RC where the capacitor is at 1nF and the resistor is at 50 ohms. Only two of the components are toleranced in this circuit. The inductor and capacitor have been given the model names IND1 and CAP2, respectively. These models are defined in the text area as:
.MODEL IND1 IND (L=1.0 LOT=10% )
.MODEL CAP2 CAP (C=1.0 LOT=10% )
The L and C parameters are merely multipliers. For example, the L parameter will multiply its value by the number defined in the VALUE attribute of the inductor. The result of this product will be the inductance value of the inductor. Since the L and C parameters are both defined as 1, placing a 10% tolerance on these parameters will tolerance the final inductance and capacitance by 10%.
|
|
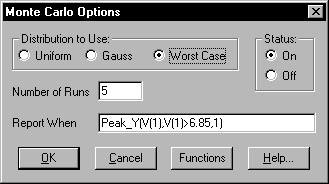
In each of the analyses, there is a Monte Carlo menu available on the main window. When first entering the analysis, you can either close the Analysis Limits dialog box or click on the window in the background to access the Monte Carlo menu. The Options choice under this menu lets you set up the parameters for the Monte Carlo analysis and invokes the Monte Carlo Options dialog box.
|
|
The Monte Carlo Options dialog box that appears above displays the settings used for this circuit in transient analysis. As can be seen in the figure, the settings show that the Monte Carlo analysis will use the worst case distribution. Since only two components are being toleranced, there are only four possible simulation runs with a worst case distribution. For this reason, the Number of Runs field has been set to five. Five was chosen rather than four because even the worst case tolerances are still chosen randomly. It is very possible that duplicate tolerance settings will be chosen before all four individual tolerance settings have been chosen. Five runs gives a greater chance for all four separate runs to appear.
The portion of the dialog box that produces the error report is the expression within the Report When text field. Micro-Cap will produce an error report whenever the expression in this field evaluates to a true condition. The expression must consist of at least one of the performance functions that exist within Micro-Cap. All of the performance functions along with their syntax can be chosen by clicking on the Functions command button. In this case, the Report When text field has been defined with the following statement:
Peak_Y(V(1),V(1)>6.85,1)
This expression uses the Peak_Y function which determines the specified Y magnitude of the nth peak in the waveform. In this case, the function is operating on the first peak of the V(1) waveform. It will evaluate to a true condition whenever the first peak of the waveform V(1) exceeds 6.85V.
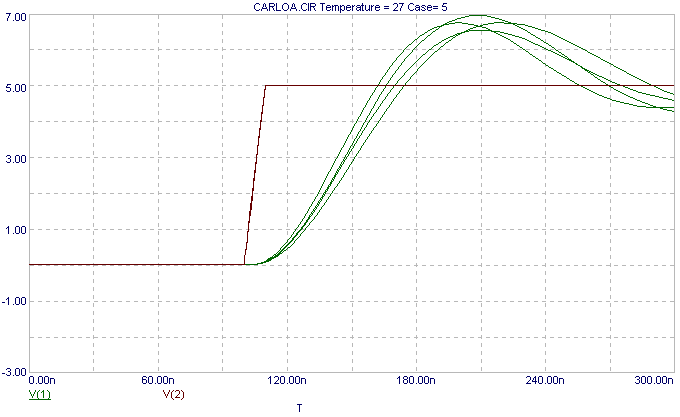
The analysis below displays the Monte Carlo transient analysis results of the circuit. Both the input and the output have been plotted.
|
|
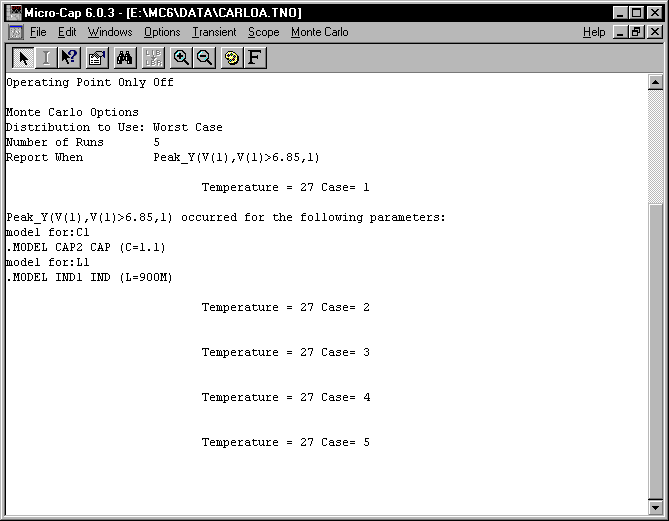
Once the analysis is complete, opening the numeric output window of the analysis lets you view the Monte Carlo error report. The figure below displays the error report for the current circuit. Whenever the Report When field returns a true value, the tolerances that generate the violation are used to calculate the equivalent model statements in the numeric output. As can be seen below, the Case 1 waveform violates the peak magnitude of 6.85V set in the Report When field. In this case, the settings that cause the error occur when the capacitor multiplier C has been toleranced to 1.1 and the inductor multiplier L has been toleranced to .9.
|
|
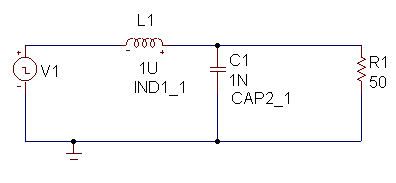
Once the error report is in the numeric output, Micro-Cap has the capability to generate a schematic from this report. Under the File menu, there is a Load MC File command. For each error listed in the numeric output, Micro-Cap will generate a schematic that uses the model parameters that caused the error. Note that this command may produce a lot of schematic files if there are many errors in the numeric output. This lets you simulate and edit the circuit that actually causes the error. The figure below shows the schematic that was generated from the error in Case 1 of the numeric output. The model names for the inductor and capacitor have each been edited to append a _1 to the end of them. In the text area, the following has been added:
Temperature = 27 Case= 1
Peak_Y(V(1),V(1)>6.85,1) occurred for the following parameters:
.MODEL CAP2_1 CAP (C=1.1)
.MODEL IND1_1 IND (L=900M)
Now the circuit that violates the specification can be edited and simulated directly so a solution may be found for the violation.
|
|
|
|
|
|


