|
|
 |
Revised Pink Noise Source
In the Summer 1998 issue of the Spectrum newsletter, a pink noise source was modelled that converted white noise with a -6dB/octave bandpass filter. However, as one user pointed out, the correct attenuation level for a pink noise filter should be -3dB/octave. This article covers two ways of creating a filter to match this specification. The first method uses a Laplace source to model an ideal representation of the filter. The second method uses a passive filter that approximates the -3dB/octave characteristic.
Ideal Filter
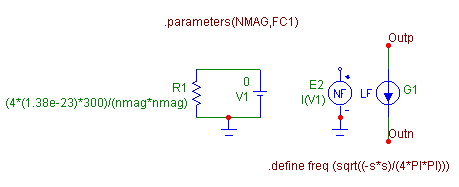
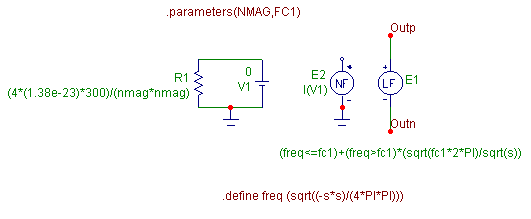
The first circuit below is the pink noise current source macro, and the second circuit is the pink noise voltage source macro. There are two parameters for each macro: NMAG and FC1. NMAG defines the magnitude of the noise current or voltage at low frequencies. FC1 defines the cutoff frequency for the filter at which frequency the attenuation band begins to take effect. The R1, V1, and E2 components produce a white noise voltage source at a magnitude of NMAG V/Hz1/2. For further description of the white noise source, see the article "White and Pink Noise Source Macros" in the Summer 1998 issue.
|

|

|
The final element in each macro is the Laplace source. The Laplace source models an ideal -3dB/octave lowpass filter. The current noise source has a LFIofV source, and the voltage noise source has a LFVofV source. The Laplace source uses the voltage produced from the E2 source, which is the white noise voltage, as its input. The LAPLACE attribute of the Laplace source is defined as:
(freq<=fc1)+(freq>fc1)*(sqrt(fc1*2*PI)/sqrt(s))
This expression defines two different gains that are dependent on what the frequency is. When the frequency is less than or equal to the value of the parameter FC1, the gain of the source is 1. When the frequency is greater than FC1, the gain of the source is sqrt(fc1*2*PI)/sqrt(s). The 1/sqrt(s) creates the desired -3dB attenuation, and the sqrt(fc1*2*PI) ensures that the gain is equal to 1 at frequency FC1 to provide a smooth transition from the low frequency gain. One thing to note in this equation is that the frequency is being defined with the variable freq instead of the normal variable F. This is done because the only variable that Laplace sources can handle is the S variable. Therefore, the frequency is modelled through the S variable by the following .define for freq:
.define freq (sqrt((-s*s)/(4*PI*PI)))
This equation produces the exact equivalent of frequency in the S domain.
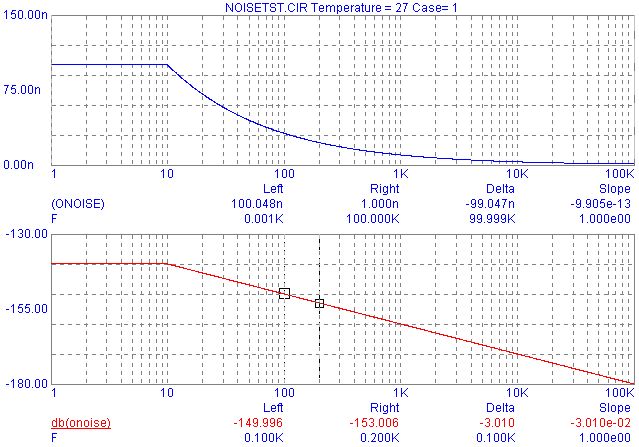
These sources will only have an effect when a noise analysis is run under the AC analysis. The plots below are the noise analysis results of the pink noise voltage source. The pink noise voltage source has been defined with a magnitude of 100nV / Hz1/2 and a cutoff frequency of 10Hz. The noise analysis has been simulated over the frequency range of 100KHz to .1Hz. The top plot displays the magnitude of the pink noise voltage source through the expression ONOISE. At low frequencies the magnitude is 100n, but as soon as the cutoff frequency of 10Hz is reached, the waveform begins its attenuation. The bottom plot displays the magnitude of the pink noise voltage source in dB through the expression dB(ONOISE). Cursors were placed at 100Hz and 200Hz in this plot. The attenuation over this octave and any other octave after the cutoff frequency is -3.01dB which is the necessary characteristic of the low pass filter.
|

|
Passive Filter
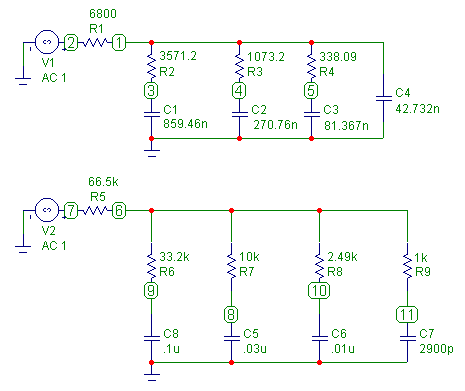
The second filter method is to create the filter out of passive elements. The figure below displays two such filters that will approximate a -3dB/octave attenuation from 10Hz to 20KHz. The top filter contains elements with exact values while the bottom filter contains elements with practical values. These filters can be used in any transient or AC analysis. However, to make them applicable as a noise source in a noise analysis a couple of changes would need to be made. First, the voltage source would need to be replaced with the white noise voltage source. Second, each resistor would need to be replaced with the dependent source IofV. The IofV would have to have its inputs connected across its outputs and its VALUE attribute defined as 1/R where R is the value of the resistance it is replacing. The resistors need to be replaced for a noise analysis because each resistor is in itself a noise source and would add to the noise of the pink source. For a standard AC or transient analysis, the circuits can be left as is, and the value of the voltage sources can be adjusted to meet the low frequency noise specification.
|

|
The figure below displays the analysis results when a standard AC analysis is run over the frequency range of 1Hz to 100KHz. The plots display the error in the pink noise filters as opposed to an ideal -3dB filter. For an ideal filter, the error would be zero, but for a passive element filter, the best that can be hoped for is an equiripple approximation. The top plot is the error of the filter with exact values, and the bottom plot is the error of the filter with practical values. As can be expected, the filter with exact values provides the better equiripple approximation although both provide a good representation over the desired frequency range.
|
|
Thanks to Rodger Rosenbaum from Trace Engineering for his help in providing one of the filters and other information for this article. The other filter comes from the 2nd edition of the textbook, Art of Electronics, by Paul Horowitz and Winfield Hill.
|
|
|
|
|


