|
|
 |
Modeling Skin Effect
In order to model skin effect, a resistor must be able to vary with frequency during AC analysis simulations. To simulate this, the FREQ attribute of the resistor must be defined. The VALUE attribute of the resistor is not effective for this type of modeling in AC analysis. The basic premise of AC analysis is that it is a small signal or linear analysis. Micro-Cap calculates the operating point and then linearizes each device about the operating point. Therefore, if the VALUE attribute of a resistor is defined as '10*f + 100', the actual resistance during the AC analysis simulation will be 100 ohms. This occurs because the resistor is linearized at the DC operating point when the frequency is equal to 0. The FREQ attribute, however, will override any specification in the VALUE attribute during a small signal simulation and lets the resistor vary with frequency during an AC run. Capacitors, inductors, and nonlinear function sources also have the ability to vary with frequency in AC analysis.
Skin Effect Definition
Skin effect is the phenomenon where the apparent resistance of a wire increases as the frequency increases. At DC, the charge carriers have an even distribution throughout the area of the wire. However, as the frequency increases, the magnetic field near the center of the wire increases the local reactance. The charge carriers subsequently move towards the edge of the wire, decreasing the effective area and increasing the apparent resistance.
The area through which the charge carriers flow is referred to as the skin depth. The skin depth is frequency dependent, and we will use it to calculate the AC resistance by implementing its transfer function in the FREQ attribute. The first step is to compute the transfer function for the AC resistance.
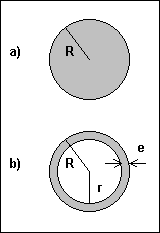
The AC and DC resistances are related through the effective area of the wire as follows. Refer to the figure below for a graphical representation of the variables used.
AC resistance / DC resistance = DC area / AC area
AC resistance = (DC area / AC area) * DC resistance
DC area = PI * R * R
AC area = (PI * R * R) - (PI * r * r)
r = R - e
e = (3.16e3 / (2 * PI)) * Sqrt(res / (f * km))
AC resistance = ((PI * R * R) / (PI * R * R - PI * (R - e)*(R - e))) * DC resistance
where e is the skin depth, res is the resistivity, f is the frequency, and km is the relative permeability. The AC resistance has now been reduced to depending on only the frequency variable and constants. It may now be implemented in the FREQ attribute of the resistor. The skin depth equation presented here is only valid for higher frequency analysis, so we will analyze it at 50kHz and higher. The next step is to implement these equations for use with a resistor. The best method for doing this is through .DEFINE user functions.
|
|
The .DEFINE user functions are a method for a user to implement his own operators. These functions can be local to the circuit if they are placed in the text area or on the schematic, or they may be global if they are placed in the DEF.MC5 file. The DEF.MC5 file can be accessed through the User Definitions item on the Options menu. The skin effect equations that were just derived can be implemented with the following two .DEFINE functions.
.define skin(DCres,res,km,rad) ((PI*rad*rad)/((PI*rad*rad)-PI*(rad-em(res,km))**2))*DCres
.define em(res,km) 503.3*(sqrt(res/(km*f)))
The skin function has four parameters. DCres is the DC resistance, res is the resistivity of the material, km is the relative permeability, and rad is the radius of the wire. The skin function calls the em function and passes it two parameters: res and km. The em function calculates the skin depth.
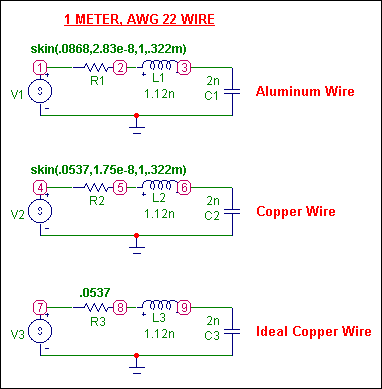
The schematic used to test the skin effect is shown below. This test schematic actually consists of three separate circuits. All of them model the resistance of a 1 meter, AWG No. 22 wire. The top circuit models the aluminum material characteristics with skin effect. The middle circuit models the copper material characteristics with skin effect. The bottom circuit models the DC resistance of the copper wire in order to compare an ideal resistor to the skin effect resistor. The inductor and capacitor were given nominal values since we are trying to display the effect that skin effect has in a simulation.
To use the skin function with the resistor, just declare the skin operator with its four parameters in the FREQ attribute of the resistor. For now, place in a nominal value for the VALUE attribute of the resistor. It won't have any affect in AC analysis when the FREQ attribute is defined, but a value must be present. Later in this article, we will cover a method to use skin effect in transient analysis. The FREQ attributes for R1 and R2 are:
skin(.0868,2.83e-8,1,.322m) ; for R1
skin(.0537,1.75e-8,1,.322m) ; for R2
The FREQ attribute for R3 is left blank as the resistor is modeled as an ideal resistor. The VALUE attribute is defined as .0537 ohms which is the DC resistance for copper.
|
|
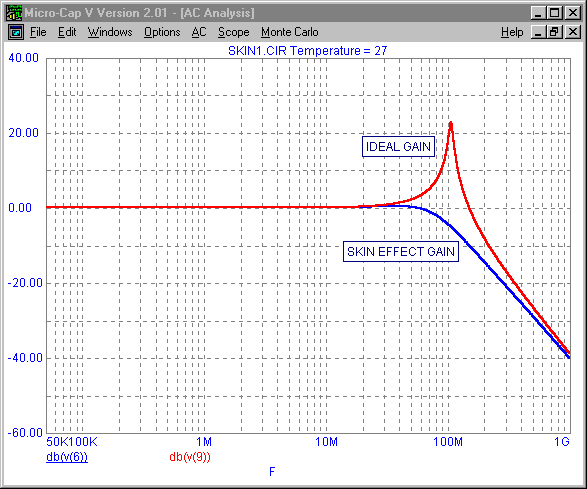
Two AC analysis simulations were performed on this schematic. The first simulation compares the gain of the copper wire modeled with skin effect resistance versus the gain of the copper wire modeled with ideal resistance. As shown in the first figure below, the higher resistance produced by the skin effect produces a lower gain than the ideal resistor, particularly at higher frequencies. The skin effect resistance also negates the resonance of the reactive components in this simulation.
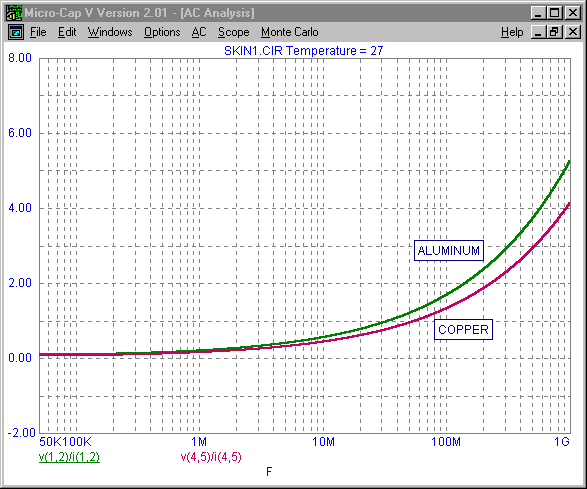
The second simulation compares the apparent resistance between an equivalent size wire made of aluminum and one made of copper. A curve of resistance vs. frequency can be plotted by specifying R(R1) fro the Y Expression field. As expected, the second figure below shows that the resistance from the aluminum wire is higher than the copper wire throughout the frequency sweep. This makes sense since both the DC resistance and the resistivity of the aluminum wire is higher.
|
|
|
For AC analysis, the .DEFINE functions will produce precise values in determining the AC resistance. However, the FREQ attribute has no effect in transient analysis. Therefore, the .DEFINE functions need to be modified to run in transient analysis. The way to modify these functions is to add in a fifth parameter that specifies the frequency at which the circuit is running. The two new .DEFINE functions are as follows.
.define skint(DCres,res,km,rad,freq) ((PI * rad * rad) / ((PI * rad * rad)-PI *
+ (rad - emt(res,km,freq))**2)) * DCres
.define emt(res,km,freq) 503.3 * (sqrt(res/(km * freq)))
The only difference between these functions and the previous functions, besides giving these unique names, is that the f variable has now been changed to a parameter named freq to represent the frequency of operation and that variable has been added to the emt function.
For the test circuit, the VALUE attributes for R1 and R2 are specified as:
skint(.0868,2.83e-8,1,.322m,fop) ; for R1
skint(.0537,1.75e-8,1,.322m,fop) ; for R2
The VALUE attribute for the V1, V2, and V3 voltage sources are all specified as:
AC 1 sin 0 1 fop
This sets the sources to an AC magnitude of 1V for AC analysis and as a sine wave for transient analysis that has a 0V DC offset, a 1V amplitude, and a frequency defined with a parameter called fop. Notice that the frequency parameter for the skint functions have also been defined with the fop parameter. This parameter represents the frequency of operation. Using a .DEFINE statement in the text area or the schematic area such as:
.DEFINE fop 10Meg
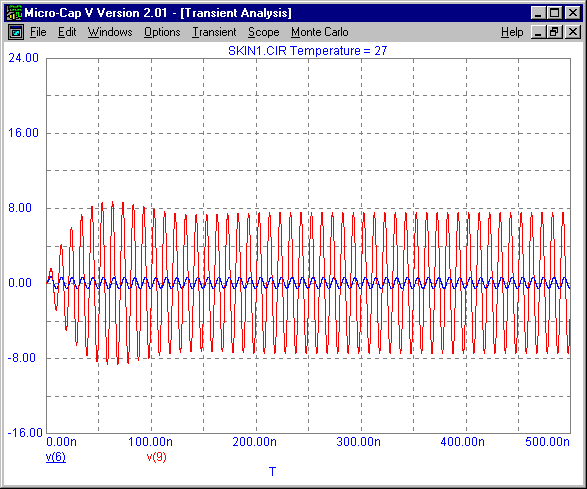
will set the frequency of operation for the voltage sources and the VALUE attributes of the R1 and R2 resistors to 10 MHz. Using a parameter in this manner, makes changing the frequency of the circuit simple since only one edit needs to be made instead of five. The figure below displays the transient analysis results of the outputs of the skin effect copper wire and the ideal copper wire. The drastic difference occurs because the frequency of operation chosen, 10 MHz, is in the resonance area for the ideal copper wire.
|
|
|
|
|
|


