|
|
 |
Worst Case Analysis
This type of analysis, which is new in MC11, provides three measures of a circuit's limiting performance:
� Root Sum Square (RSS). This computation is an estimate of the probable worst
case limits of the circuit's performance function.
� Monte Carlo Analysis (MCA). This is an estimate of the probable worst case limits of the circuit's
performance function derived from a Monte Carlo run.
� Extreme Value Analysis (EVA). This is an estimate of the most extreme limits of the circuit's
performance function. There is standard EVA based upon sensitivities and EVA Optimizer which finds
the extreme values through the use of the internal optimizer function.
Worst Case is available for AC, DC, DC operating point, and transient analysis.
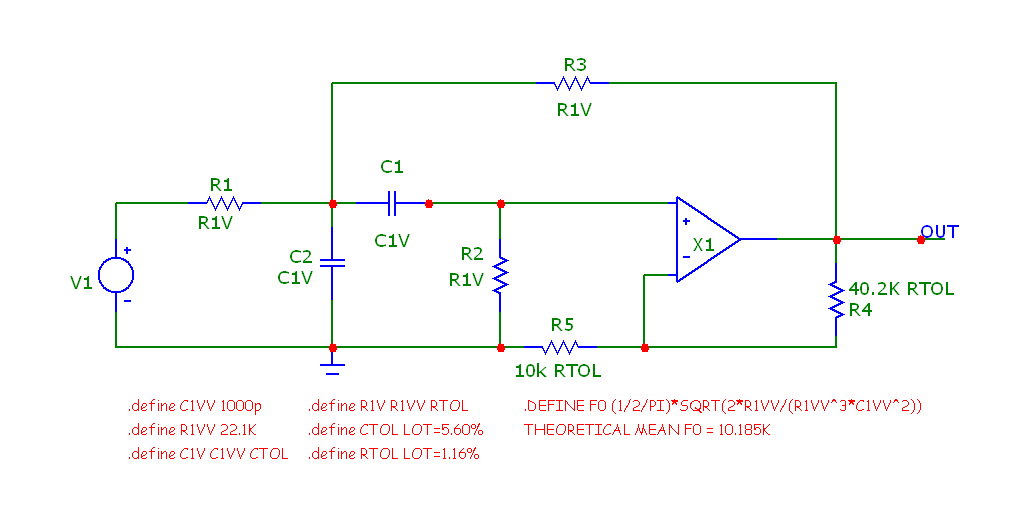
How would you use this type of analysis? Consider this bandpass filter.
One important performance characteristic is the filter's center frequency. The nominal center
frequency is easily calculated as 10.185KHz, but what about the worst case? We treat the OPAMP
as ideal, so the tolerances are limited to the resistors and capacitors.
These have initial tolerances and one type of bias tolerance called Aging. All of these
tolerances add up to a shifting center frequency. To see how, let's run this circuit in AC
analysis Worst Case. To do so you first select AC analysis (or use Alt+2), then select the
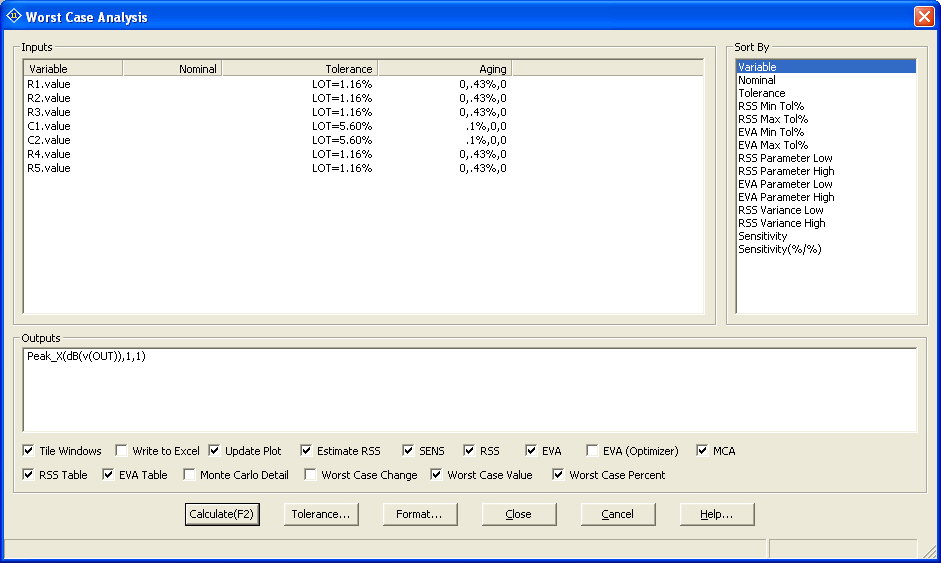
Worst Case option from the AC menu (or use Alt+6). The display looks like this:
This dialog box shows the toleranced components. There are five resistors with an initial
tolerance of 1.16% and two capacitors with an initial tolerance of 5.6%. In addition, the
resistors have a negative aging bias tolerance of 0.43% and the capacitors have a positive
aging bias tolerance of 0.1%. The aging bias tolerances are displayed as a triplet of
values that represent a negative value, a positive value, and a random value:
Neg, Pos, Rnd
Either Neg or Pos must be zero. Each of these can be absolute or a percentage of the
initial parameter. A positive or negative bias tolerance means an automatic drift that
can always be expected and that is added in before any statistical effects are considered.
Components can have any number of bias tolerances to account for different lifetime
exposure effects like aging, humidity, temperature, voltage stress, and radiation.
Press F2 and the program will compute the three measures of worst case. Here is a
summary of the results:
AC Worst Case
Output Function = Peak_X(dB(v(OUT)),1,1)
Nominal value = 10.185K
Worst case value of Peak_X(dB(v(OUT)),1,1)
By Root Sum Squared Low +9.736K
By Root Sum Squared High +10.600K
By Monte Carlo Analysis Low +9.798K
By Monte Carlo Analysis High +10.536K
By Extreme Value Low +9.494K
By Extreme Value High +10.927K
The RSS results suggest that the center frequency limits expected to within the SD tolerance
(in this case SD=2.58 reflecting a 1% expected failure rate) are:
Low = 9.736K
High = 10.600K
The Monte Carlo results largely agree and suggest that the center frequency limits expected to within the SD tolerance
(in this case SD=2.58 reflecting a 1% expected failure rate) are:
Low = 9.798K
High = 10.536K
Finally, the extreme value analysis (EVA) results suggest that the absolute worst case center frequency
limits expected are:
Low = 9.494K
High = 10.927K
If each toleranced parameter has a 1% chance of being exceeded, and if there are five such uncorrelated
parameters (R4 and R5 don't impact the center frequency), then the chance of these EVA limits being
exceeded is
Chance = .01^5 = 1e-10
|
|
|
|
|