|
|
 |
Creating Wingspread Plots
The wingspread plot is a type of plot used to display the large signal linearity of an output stage. It derives its
name from the fact that the waveform plotted looks similar to the look of a simple drawing of a bird. It is typically
used in audio amplifier design and is quite useful in simulating the crossover distortion. The wingspread plot helps
in determining the optimal quiescent conditions that should be used in order to minimize the gain deviations around the
crossover point for a specific load resistance. The following example uses a technique to simulate wingspread plots
that is described in Bob Cordell's book " Designing Audio Power Amplifiers".
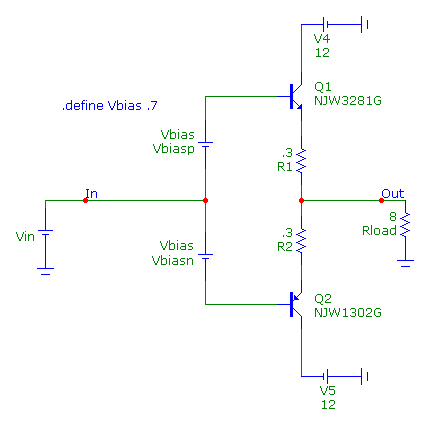
The circuit below is a class AB output stage. It uses a complementary pair of transistors from ON Semiconductor: the
NJW3281G NPN transistor and the NJW1302G PNP transistor. The Vin battery defines the input voltage to the stage. The
Vbiasp and Vbiasn batteries bias the output stage and set the quiescent bias current for the circuit. Both of the
batteries have their VALUE attribute set as Vbias whose value is specified by the following define statement:
.define Vbias .7
The class AB output stage is powered by +/- 12V power supplies and is driving an 8 ohm load resistance.
|

|
The wingspread plots are created in DC analysis. The input voltage is swept over a range of -10V to 10V in steps of
10mV. In the DC Analysis Limits, the Variable 1 fields are set to the following:
Method: Linear
Name: Vin
Range: 10,-10,.01
Sweeping the input voltage will create a single wingspread waveform. In most cases, it is useful to view a range of these
waveforms by stepping the bias conditions of the circuit in order to determine the appropriate bias condition. For this
circuit, stepping the Vbias parameter from .6V to .7V in steps of 10mV creates a nice set of waveforms. In the DC Analysis
Limits, the Vbias parameter is stepped by setting the Variable 2 fields to the following:
Method: Linear
Name: Param VBias
Range: .7,.6,.01
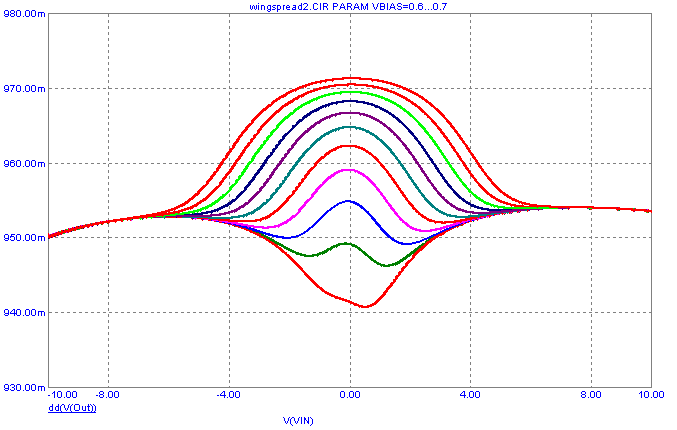
The gain of the output stage can be plotted by using an expression that takes the derivative of the output voltage with respect
to the input voltage. The expression:
dd(V(Out))
will produce the desired output. The dd( ) operator calculates the numerical derivative of the specified expression with respect
to the parameter being swept in the Variable 1 field which in this case is the input voltage. When the simulation is run, the
following wingspread plot is created.
|

|
As can be seen in the plot, small changes in the bias can create quite a bit of crossover distortion in the output gain. The optimal
bias for this particular circuit appears to be at around .62V
References:
1) Designing Audio Power Amplifiers, Bob Cordell, McGraw Hill, ISBN 978-0-07-164024-3
|
|
|
|
|


