|
|
 |
Creating Nichols and Nyquist Plots
The typical polar plot used in AC analysis is the well known Bode plot. However, there are numerous other polar plot types that can be
useful in analyzing a circuit. Two of the more popular ones are the Nichols and Nyquist plots. Both of these plots can be easily
created within Micro-Cap by setting up the appropriate expressions in the AC analysis limits.
Nichols plot
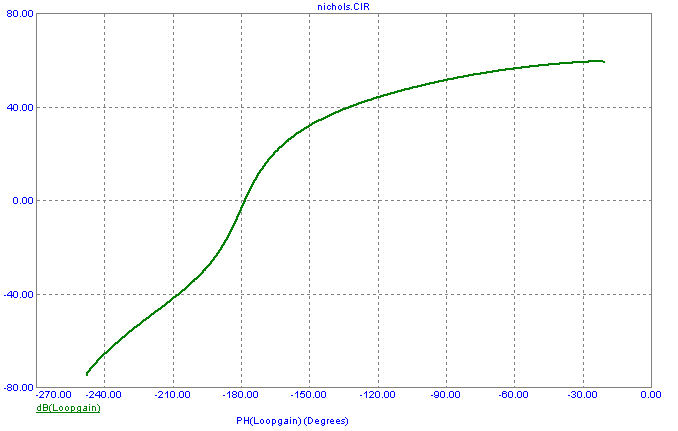
The Nichols plot is frequently used with signal processing and closed loop control systems. This plot provides a means to quickly read
specifications such as phase margin and gain margin to help determine the stability of the system. In this plot, the magnitude of the output
in decibels is plotted versus the output phase of the frequency response. In order to do this in Micro-Cap, in the AC Analysis limits, set
the Y Expression to:
dB(Output)
and the corresponding X Expression to:
ph(Output)
where Output is the desired output expression of the circuit. That can be any expression such as V(Out), I(RLoad), or something more complex.
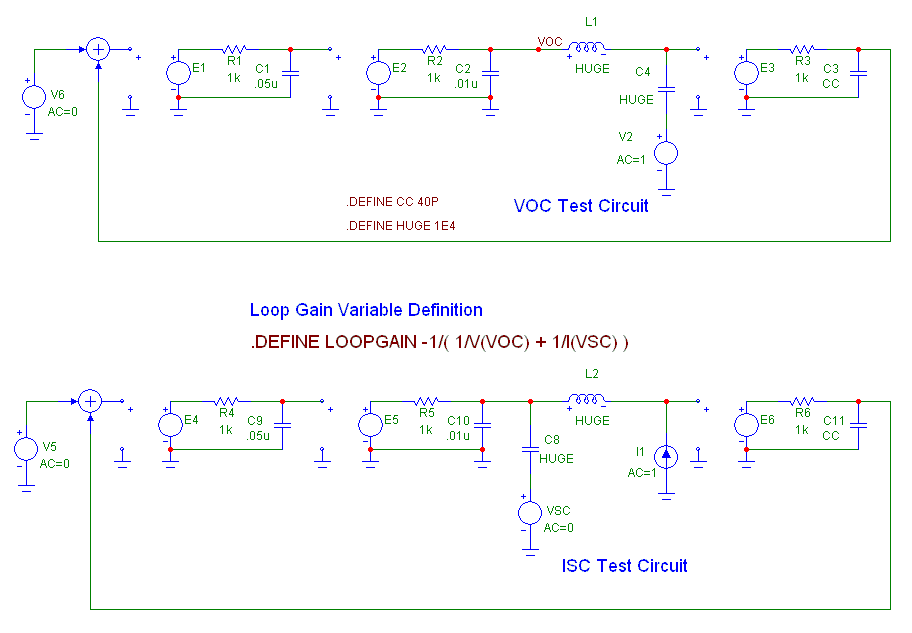
The schematic below uses the open loop gain technique described in the Winter 2001 newsletter issue. An AC analysis is run on this schematic
that produces the Nichols plot shown below.
In this analysis, the expression dB(Loopgain) is plotted versus ph(Loopgain). Loopgain is a variable defined in the schematic to measure the
open loop gain of the circuit.
|

|

|
Nyquist plot
The Nyquist plot is also frequently used with signal processing and control systems to help determine the stability of the system. It can be
used to help measure the phase margin and gain margin along with the poles and zeros of the transfer function. In this plot, the
imaginary quantity of the output is plotted versus the real quantity of the output. In order to do this in Micro-Cap, in the AC
Analysis limits, set the Y Expression to:
Im(Output)
and the corresponding X expression to:
Re(Output)
where Output is again any type of expression that the user would like plotted. An AC analysis is run on the previous open loop gain schematic
which produces the Nyquist plot shown below.
In this analysis, Im(Loopgain) is plotted versus Re(Loopgain).
Any variety of polar plots can be created in this manner by just setting the X Expression and Y Expression fields on a plot line to the approprate expressions.
|
|
|
|
|


