This section is designed to highlight one or two features per issue that may be overlooked because they
are not made visually obvious with a toolbar button.
Keep X Scales the Same option
The Keep X Scales the Same option forces all horizontal scales using the same X expression to use the
same X scale range. This option is available under the Scope menu when in an analysis.
When this option is enabled, drag scaling or panning in one plot group will change the horizontal scale
in all other plot groups that have the same X expression. This option is convenient when you want
separate plot groups for the waveforms but want the X scale ranges to track each other. This option
provides a simple operation to examine the details of multiple waveforms over a specific time range
rather then having to scale each plot group separately.
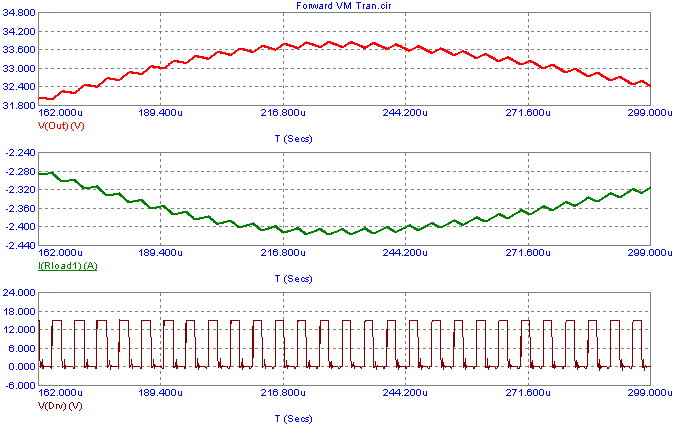
In the plot below, the initial simulation was run for 1ms. In order to closely examine the waveforms,
the top plot group was scaled with the mouse to show a narrow range of the waveform from approximately
162us to 299us. Once the top plot rescales, all of the other plot groups also rescale to this new X
range.
While the scaling operation in the plot can also affect the Y range for that plot group, the other
plot groups will maintain the Y ranges that were previously defined for them.
|