|
|
 |
Frequency Weighting Filter Macro
Sound pressure level is an objective measurement in decibels of the pressure change between the
sound wave and the medium it is traveling through. Since human hearing is more sensitive to certain
frequencies within the audible frequency range (approximately 20Hz to 20kHz), frequency weighting is
used to get a better idea of what sound pressure levels would be perceived as loud by a person.
Within the audible frequency range, the human ear is less sensitive to the lower and higher frequencies.
Several weighting filters have been developed to compensate for this effect. Some of the common
weighting filters are the A-, B-, C-, and D-Weighting curves. The transfer functions for these four
curves are well known and can be easily modeled within Micro-Cap through the use of a Laplace source.
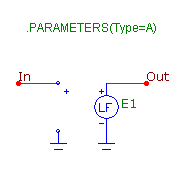
A macro that models all four of these weighting curves is shown in the figure below.
|

|
The macro circuit has just a single parameter that is passed through to it. The parameter is named
Type, and it must be defined as either A, B, C, or D within the circuit that is using the macro.
The default value of Type is A since that is the most commonly used filter of the four.
The macro consists of a single LFVofV (Laplace Formula Voltage of Voltage) component. The LAPLACE
attribute for the LFVofV is defined with the Type parameter. The In node is connected to the input of
the LFVofV component, and the Out node is connected to the output of the LFVofV component. Basically,
the macro models the transfer function that is defined for the LFVofV. In the Text page of the macro
circuit are several define statements which set the behavior of the Laplace source depending on the
value of the Type parameter. The define statements are used to specify the transfer functions of the
frequency weighting curves and are specified as follows:
A-Weighting
.define Ka 7.39705e9
.define A (Ka*s^4)/((s+129.4)^2 * (s+676.7) * (s+4636) * (s+76655)^2)
B-Weighting
.define Kb 5.99185e9
.define B (Kb*s^3)/((s+129.4)^2 * (s+995.9) * (s+76655)^2)
C-Weighting
.define Kc 5.91797e9
.define C (Kc*s^2)/((s+129.4)^2 * (s+76655)^2)
D-Weighting
.define Kd 91104.32
.define D (Kd*s*(s^2+6532*s+4.0975e7))/((s+1776.3) * (s+7288.5) * (s^2+21514*s+3.8836e8))
Now the way that the macro works is that the value of the Type parameter determines which of the above
define statements will be used within the Laplace source. For example, if the Type parameter is
specified with the value of B within the circuit using the frequency weighting macro, the LAPLACE
attribute of the Laplace source will then be defined with the value B. The Laplace source will then
use the corresponding define statement specified above for the B variable.
A simple circuit was created to simulate the transfer function curve of each of the frequency weighting
filters. The circuit consists of just the frequency weighting macro along with a Voltage Source
component which is placed at the input to the macro. The AC magnitude value of the Voltage Source
has been set to one. The Type parameter of the macro was defined with the symbolic variable Weight
that is set with the following define statement:
.define Weight A
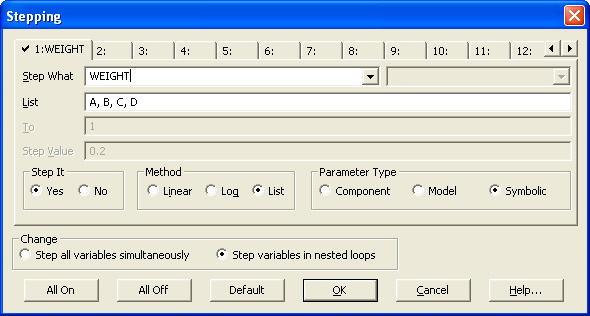
In order to plot all four of the weighting transfer functions in a single plot using just one macro,
the Weight symbolic variable will be stepped so that it steps through the values A, B, C, and D.
The settings within the Stepping dialog box to step Weight in this manner are shown below. Since
the variable is being stepped using text values, the Method used must be List. In the List field,
the text strings that are to be stepped are entered in a comma delimited list.
|

|
The resulting AC analysis is shown below. Each of the four weighting curves available in
the macro have been stepped through. The plot curves match up precisely to the transfer
functions specified for the weighting curves.
|
Reference:
1) http://www.ptpart.co.uk/show.php?contentid=70#FrequencyWeighting
|
|
|
|
|


