|
|
 |
Quasi Small Signal Analysis
The standard AC analysis is a small signal analysis that calculates the DC operating point of a circuit and then
linearizes the devices about the operating point values. For AC analysis to produce reasonable results, the
operating point values should be characteristic of the circuit's standard mode of operation such as the linear
mode of operation for an opamp circuit. With switching circuits, there are commonly two modes of operation that
an AC response would have to take into account. Since a standard AC analysis can only take into account a single
mode, different methods must be used to obtain a frequency response.
One method is to use average models of all the switching components in the schematic. Average models average
the state equations of the two switch positions over a switching cycle, but they are not very common and can be
difficult to create. The method that will be described in this article is a quasi small signal analysis that
uses the Fourier capabilities of transient analysis to convert a nonlinear simulation into its frequency domain
equivalent.
|

|
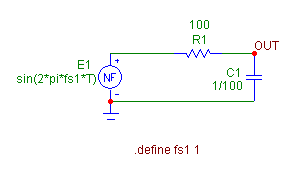
The example circuit used to demonstrate this technique is displayed above. The circuit is a simple low pass RC
filter. A linear circuit is used in this example instead of a switching circuit in order to be able to compare
the quasi small signal analysis to the standard AC analysis. In addition to the RC filter, the only other
component in the schematic is a nonlinear function voltage source whose main attributes are defined as:
VALUE = sin(2*PI*FS1*T)
FREQ = 1
The Freq attribute, if defined, has priority over the Value attribute during an AC analysis, and in this case,
it defines a 1 volt small signal source for an AC simulation run. The Freq attribute will be ignored during a
transient simulation. The Value attribute defines a one volt peak amplitude sine wave signal during a transient
run whose frequency is set by the symbolic variable FS1. FS1 has its value set through a define statement
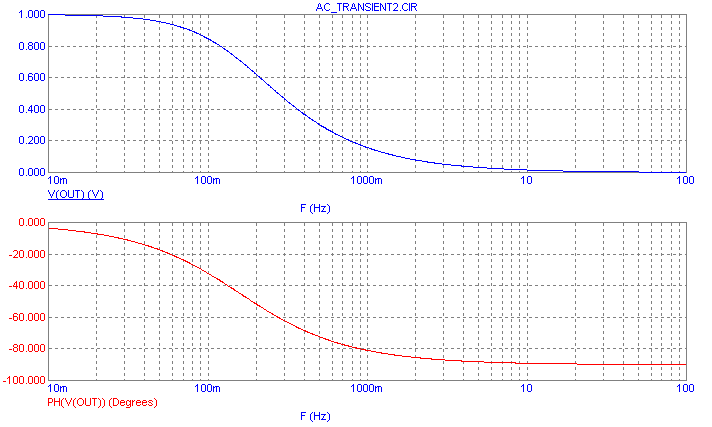
present in the schematic. The standard AC analysis is displayed below. The magnitude of the output
voltage is the top plot, and the phase of the output voltage is the bottom plot. This plot will be the
benchmark for the quasi small signal results.
|

|
The quasi small signal analysis is simulated through the transient analysis capabilities of Micro-Cap. For
transient analysis, the symbolic variable FS1 will be stepped in order to obtain the circuit's output
waveform at different frequencies of operation. In the Stepping dialog box, the List method has been
selected for FS1, and the list of values to be stepped through has been defined as:
.01,.02,.04,.08,.1,.2,.4,1,2,5,10,25
One limitation of the quasi small signal analysis method is that it has to run a full transient simulation for
each frequency, so the run time can get lengthy. Therefore, both the frequency range and the number of frequency
samples will tend to be limited when compared to the standard AC analysis. For this example, three to four
frequency samples will be taken for each decade as the range varies from .01Hz to 25Hz.
The next step is to determine the appropriate Time Range and Maximum Time Step values that will provide a good
sample across all of the different frequencies. Since the smallest frequency being simulated is .01Hz, the
minimum time range for a single cycle at that frequency must be 100s. All of the other frequencies specified
also share 100s as a common period multiple so this can be the sampling range that will be used. However, since
there is an initial startup transient that will need to be ignored for a proper Fourier analysis, the Time Range
field will be set to 200s so that the waveforms are given time to settle. In the FFT page of the Analysis
Properties dialog box, the Upper Time Limit value is set to 200 and the Lower Time Limit value is set to 100. These
settings will exclude the initial transient from the Fourier analysis and set the range that the Fourier analysis
will sample to the last hundred seconds of the simulation. With this range, the Fourier will produce a frequency
sample every .01Hz. Therefore, the Number of Points field in the FFT page has been set to 65536 to ensure that
the Fourier samples will be adequate for the higher frequencies being simulated.
For the Maximum Time Step, the value will be set according to the highest frequency being simulated. In this
case, the highest frequency has been specified as 25Hz which translates into a period of 40ms. Setting the
Maximum Time Step to 1ms will produce a minimum of forty data points per cycle at 25Hz and will provide a good
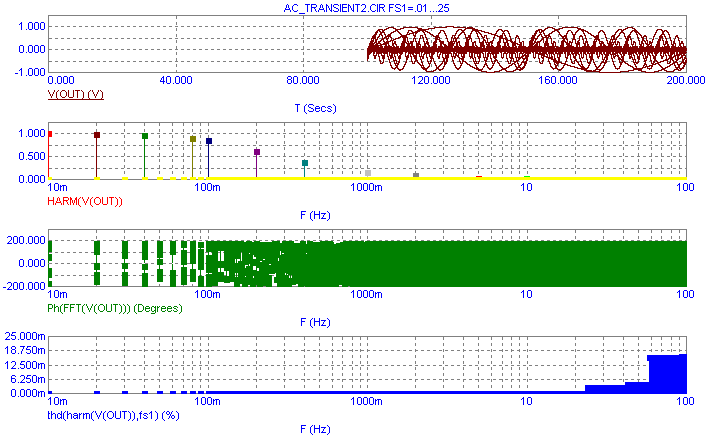
sampling for all of the frequencies being simulated. The resultant transient analysis is displayed below.
|

|
The top plot is the actual voltage of node Out at each frequency step. The first 100s of simulation data has been
discarded due to the settings in the FFT page of the Analysis Properties dialog box. The second plot displays the
harmonic content of each of the stepped output waveforms. The third plot displays the phase output of the Fourier
plots for each of the stepped output waveforms, and the bottom plot shows the total harmonic distortion of node Out
at each frequency step. Note that the Thd operator has had its optional reference frequency parameter defined as
FS1 so that the distortion will be calculated versus the frequency of operation for each step. Although the
distortion in this analysis is due to timestep aliasing, there is one slight difference in the following technique
for the Thd operator that makes it a worthwhile addition to this example.
Though all of the important data is displayed on the screen, it is not in an easily readable format in determining
the quasi small signal response. A performance plot can be used to extract the appropriate data and provide a better
visualization of the frequency information. Performance plots can be generated by right clicking on the waveform
name in the plot or by selecting the menu option Transient/Performance Windows/Add Performance Window. For this
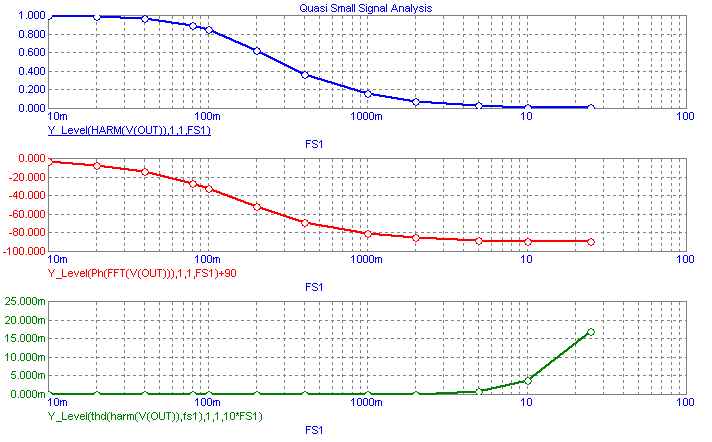
example, the performance plot created is displayed below. The plot has been defined to display the following
three waveforms:
Y_Level(HARM(V(OUT)),1,1,FS1)
Y_Level(PH(FFT(V(OUT))),1,1,FS1)+90
Y_Level(THD(HARM(V(OUT)),FS1),1,1,10*FS1)
The Y_Level operators will return the Y value of each stepped waveform at the X value that is specified within
the expression. The top waveform plots the value of the harmonic of V(Out) at frequency FS1 for each stepped
frequency. The plot reproduces the AC gain response and matches the V(Out) waveform from the standard AC analysis
simulation.
The middle waveform plots the value of the phase of the Fourier response of V(Out) at frequency FS1 for each
stepped frequency. This plot reproduces the AC phase response and matches the Ph(V(Out)) waveform from the
standard AC analysis simulation. Note that an offset of 90 degrees was added to the waveform expression. This
offset compensates for the use of the cosine expressions within the Fourier mathematical routines and aligns the
phase plot with the typical AC results.
The bottom waveform plots the total harmonic distortion level at frequency 10*FS1 for each stepped frequency.
Since FS1 is the reference frequency at which the distortion is measured against, the data must be extracted from
a frequency greater than FS1. Setting the X value to 10*FS1 will include the second through tenth harmonics in
the distortion calculation. One caveat to this procedure is that enough points must be calculated for the Fourier
plots. For example, if the Number of Points field was set to 8192 in the FFT page, at the .01Hz sampling used in
this example, the frequency information would only extend out to 40.96Hz. There would not be data available at
10*FS1 for the 5Hz, 10Hz, and 25Hz steps, and the Y_Value expression would return a value of zero for those
points.
|

|
|
|
|
|


