|
|
 |
Creating Eye Diagrams
The purpose of an eye diagram is to analyze the transition time deviations of a digital communications
signal. The deviations, also known as jitter, are a measure of the signal quality and represent the
variance in the actual transition time from the ideal transition time. In addition to jitter, an eye
diagram also produces information on the voltage swing, the rise time, and the fall time of the signal.
Jitter is apparent when a repetitive waveform is displayed versus a reference waveform. To create an
eye diagram with an oscilloscope, one uses the horizontal sawtooth oscillator to display the waveform
versus the sawtooth. This sawtooth is achieved in Micro-Cap through the use of the Mod function.
|

|
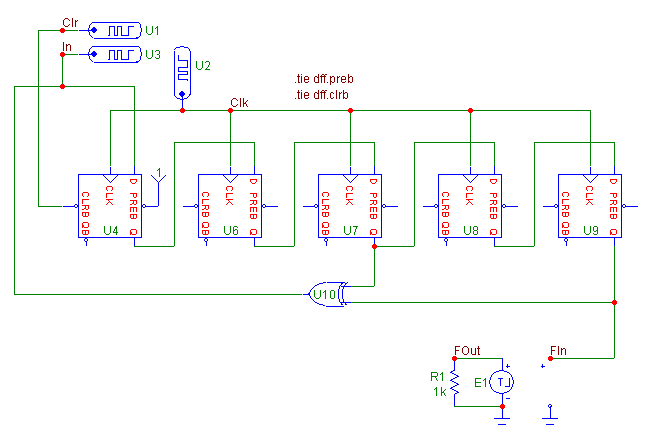
The circuit above creates a bit stream that can be analyzed through an eye diagram. The bit stream is
produced by a basic five bit shift register, consisting of five D flip-flops, that has the outputs of
the third and fifth flip-flop as inputs to an exclusive-or gate. The output of the exclusive-or gate
is then fed back into the D input of the first flip-flop. Note that the PREB and CLRB pins for all of
the flip-flops are connected together using the .TIE statement such as:
.TIE DFF.PREB
.TIE DFF.CLRB
The first statement connects the PREB pin of all D flip-flops in the circuit to one node, and the second
statement does the same for the CLRB pin of all D flip-flops. Three digital stimulus sources control the
input to the register. The U1 digital stimulus clears the flip-flops with a short zero pulse at the
beginning of the simulation. The U2 stimulus creates a clock signal with a 5ns period. The U3 stimulus
ensures that a one state is present at the In node during the first clock transition. After this clock
transition, the stimulus produces a high impedance state for the rest of the run in order to not interfere
with the feedback from the exclusive-or gate.
The output of the fifth flip-flop is passed into a Laplace Table source which has been defined to act as
an ideal bandpass filter. The FREQ attribute for the LTVofV source has been defined as:
(1,-40,0) (1k,-40,0) (1Meg,0,0) (100Meg,0,0) (300Meg,-40,0)
Between 1MHz and 100MHz, the signal will pass through unhindered. At any other frequency, the signal will
be attenuated.
The eye diagram is created in transient analysis. The Mod function is used to create the sawtooth
waveform needed in the X Expression field. The Mod function is the remainder after integer division.
Mod produces a sawtooth when used in a transient expression in the form of '(T - delay) Mod Per'. The
delay value specifies the amount of analysis time that will be excluded from the eye diagram. The Per
value in the Mod expression is the period of the sawtooth which is usually a multiple of the data
period.
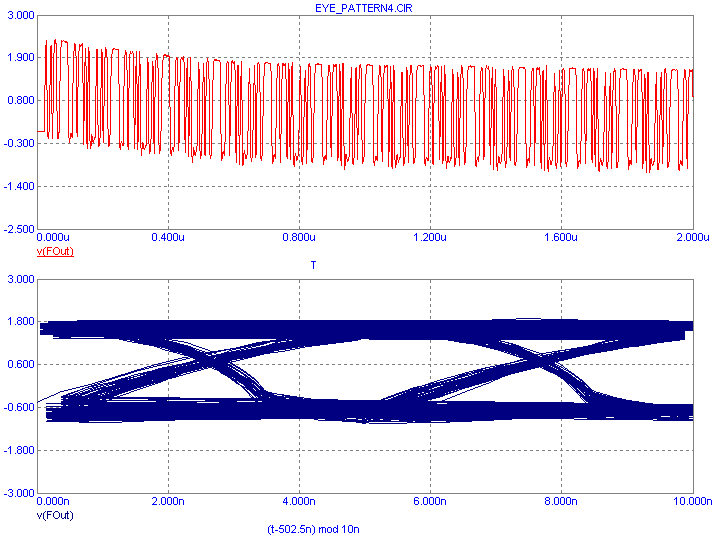
The resulting eye diagram appears below. The top waveform is the actual output of the bandpass
filter, v(FOut), over the entire 2us analysis run. The bottom waveform also plots V(FOut), but it does
so versus the sawtooth waveform created by the following X expression:
(t-502.5n) mod 10n
This will create the desired eye diagram. The delay in the expression has been set to 502.5ns. The
delay was set to such a large number in order to eliminate much of the initial transient of the v(FOut)
waveform. The period has been set to 10ns to cover two of the clock cycles.
|

|
|
|
|
|


