|
|
 |
Using Probe on a Spice File
Until very recently, you couldn't use the Probe feature on a SPICE file. It could only be used with a schematic. Well for you diehard SPICE fans, Probe is now available for SPICE files as well. Here's how it works.
You open a SPICE file, select Probe Transient, Probe AC, or Probe DC. MC6 presents an abbreviated Analysis Limits dialog box to let you change the simulation parameters. After making any changes you might want, click on the Close button. MC6 runs the simulation, saves the results to disk, and waits for a mouse click.
Only voltage and current are available. The Vertical menu lets you select which.
If voltage is selected from the Vertical menu and the analysis type is DC or transient, a node click will select the node voltage. A part name click will select the device voltage if the part is a two-terminal part, or enable selection from a list of one of the pin-to-pin voltages in a three or more terminal part.
If current is selected from the vertical menu, a node click will produce nothing. A part name click will select the device current if the part is a two-terminal part, or enable selection from a list of one of the pin currents in a three or more terminal part.
To illustrate, consider the circuit below:
E:\MC6\DATA\CHOKE.CKT Transient Analysis
C1 0 B 2UF
D1 3 A D0
D2 1 A D0
L1 B A 5
R1 0 B 10K
R2 0 A 10K
V1 1 0 SIN (0 100 50 0 0 0)
V2 0 3 SIN (0 100 50 0 0 0)
.MODEL D0 D (IS=10F CJO=10P)
.TRAN 0.00263158 0.05 0 0.0002
.TEMP 27
.END
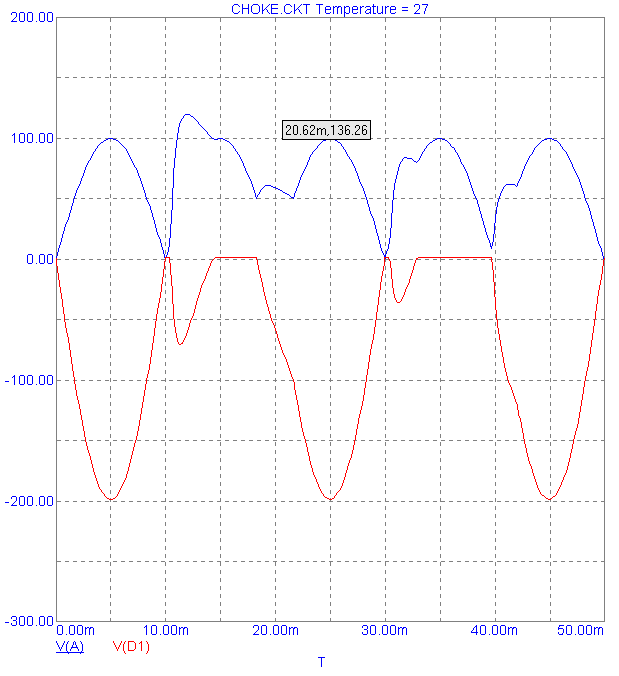
If you run Probe Transient on this circuit and click on the "A" node name, you get a plot of the node voltage waveform on node A. Probe on the D1 name and you get a plot of the voltage across D1. The two plots look like this:
|

|
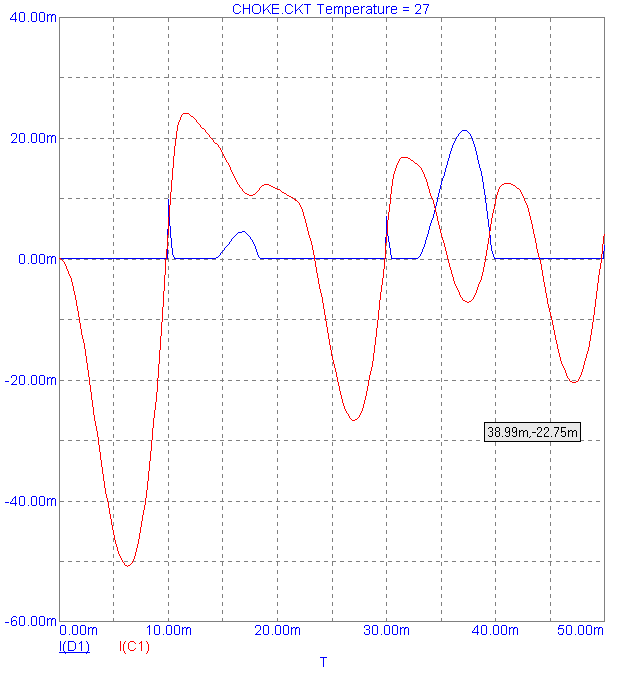
If you select Current from the Vertical menu and then click on the D1 name, you get a plot of the current through the diode D1. Likewise, click on the C1 name and you get a plot of the current through the capacitor C1. The two plots look like this:
|

|
As an example of probing AC consider this circuit, translated to SPICE from the UA709 sample schematic.
C1 19 4 5NF
C2 24 21 200PF
Q1 2 5 6 QNL
Q2 2 6 7 QNL
Q3 4 9 10 QNL
Q4 5 11 10 QNL
Q5 8 8 7 QNL
Q6 12 13 7 QNL
Q7 12 4 13 QNL
Q8 15 15 16 QNL
Q9 10 15 17 QNL
Q10 1 12 20 QNL
Q11 23 21 22 QNL
Q12 16 23 24 QPL
Q13 1 23 24 QNL
Q14 1 2 3 QNL
Q15 21 7 18 QPL
R1 5 3 25K
R2 14 7 3.6K
R3 16 17 2.4K
R4 18 14 10KZ
R5 8 13 3K
R6 19 12 1.5K
R7 1 12 10K
R8 21 22 10K
R9 0 11 1K
R10 25 9 1K
R11 9 24 100K
R12 15 14 18K
R13 6 8 3K
R14 16 22 75
R15 24 18 30K
R16 18 20 1K
R17 1 23 20K
R18 1 2 10K
R19 4 3 25K
V1 1 0 15
V198 0 16 15
V709 25 0 AC 1 SIN 0 10M 10K
.MODEL QNL NPN (BF=80 VAF=50 RB=100 CJE=3P CJC=2P CJS=2P TF=300P TR=6N)
.MODEL QPL PNP (BF=10 CJC=4P CJE=6P RB=20 DEV=50% VAF=50 TF=1N TR=20N)
.AC DEC 6 1 1e+008
.TEMP 27
.PLOT AC VDB(24)
.PRINT AC VDB(24)
.END
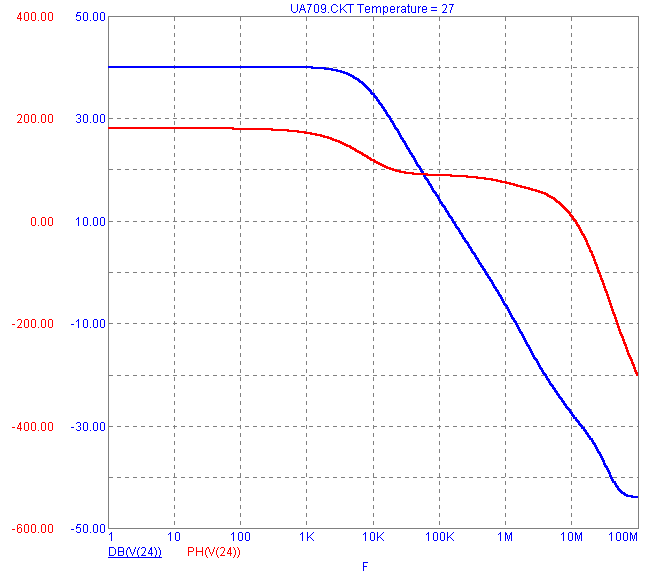
Here is the result of clicking on any of the references to the output node 24. The voltage on node 24 is shown as DB(V(24)) and its phase is shown as PH(V(24). The plots have been selected after disabling the Same Y scales option on the Scope menu. This alllows each to have its own scale and still be plotted on the same graph.
|

|
|
All of the features of schematic probing are available in SPICE probing except that only current and voltage can be "probed", although they can be manually added with the "Add Plot" command from the Probe menu.
|
|
|
|
|


