|
|
 |
|

|
AC Analysis
|

|

|
| |
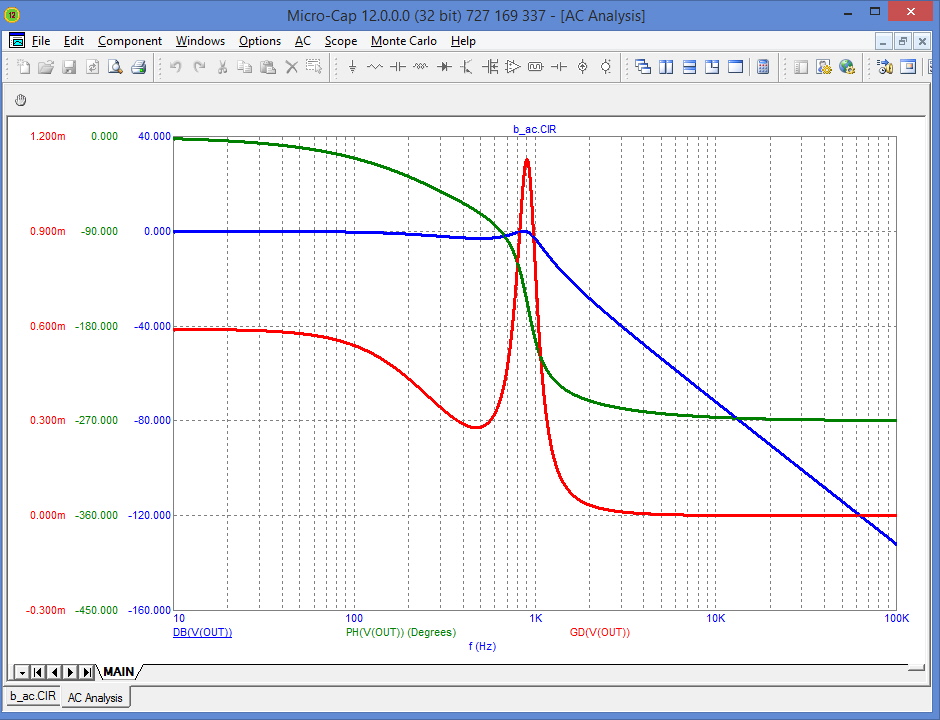
AC analysis lets you investigate small signal behavior.
You can plot voltage or current and produce Bode
plots, Nyquist diagrams, Nichols charts, Smith charts, polar plots,
and noise plots. Other operators - including real, imaginary,
magnitude, phase, and group delay - make analysis and plotting easy.
Micro-Cap provides automatic frequency step control for smooth plots
with a minimum number of calculations, greatly speeding AC analysis
|
| |
|
|
|


